Answered step by step
Verified Expert Solution
Question
1 Approved Answer
Intensive resource extraction industries such as mining heavy metals often have negative consequences on the health of the people working in them. Prolonged exposure


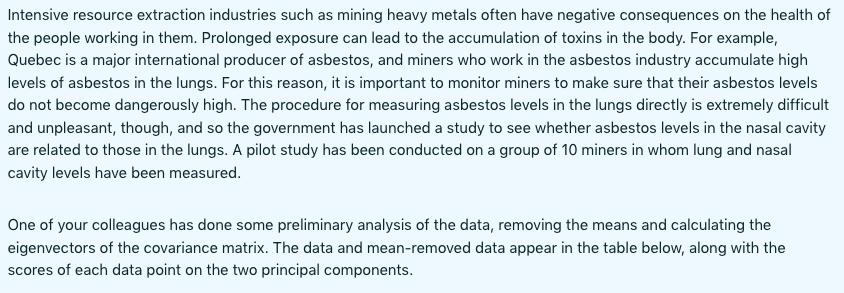
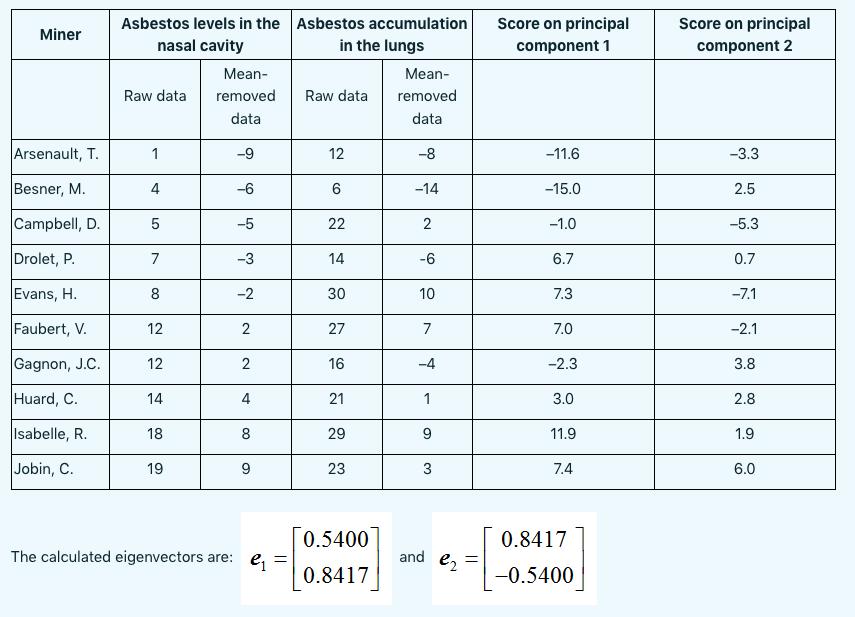
Intensive resource extraction industries such as mining heavy metals often have negative consequences on the health of the people working in them. Prolonged exposure can lead to the accumulation of toxins in the body. For example, Quebec is a major international producer of asbestos, and miners who work in the asbestos industry accumulate high levels of asbestos in the lungs. For this reason, it is important to monitor miners to make sure that their asbestos levels do not become dangerously high. The procedure for measuring asbestos levels in the lungs directly is extremely difficult and unpleasant, though, and so the government has launched a study to see whether asbestos levels in the nasal cavity are related to those in the lungs. A pilot study has been conducted on a group of 10 miners in whom lung and nasal cavity levels have been measured. One of your colleagues has done some preliminary analysis of the data, removing the means and calculating the eigenvectors of the covariance matrix. The data and mean-removed data appear in the table below, along with the scores of each data point on the two principal components. Asbestos levels in the Asbestos accumulation Score on principal Score on principal Miner nasal cavity in the lungs component 1 component 2 Mean- Mean- Raw data removed Raw data removed data data Arsenault, T. 1 -9 12 -8 -11.6 -3.3 Besner, M. 4 -6 6 -14 -15.0 2.5 Campbell, D. 5 -5 22 2 -1.0 -5.3 Drolet, P. 7 -3 14 -6 6.7 0.7 Evans, H. 8 -2 30 10 7.3 -7.1 Faubert, V. 12 2 27 7 7.0 -2.1 Gagnon, J.C. 12 2 16 -4 -2.3 3.8 Huard, C. 14 4 21 1 3.0 2.8 Isabelle, R. 18 8 29 9 11.9 1.9 Jobin, C. 19 9 23 3 7.4 6.0 0.5400 The calculated eigenvectors are: = and = e2 0.8417 0.8417 -0.5400 Your supervisor assigns you three tasks: a. Verify your colleague's preliminary analysis by: i. Determining the covariance matrix yourself. ii. Verifying that the vectors she has calculated are indeed the eigenvectors of that matrix and computing the associated eigenvalues. iii. Verifying that the method used to calculate the scores of the data points on the first and second principal components is correct by calculating the scores for H. Evans yourself. b. Prepare a graphical summary of the data: i. Draw a scatter plot of the data set together with the principal axes. ii. On the scatter plot from part a, graphically represent the first principal component score for H. Evans by illustrating the projection of his data point onto the first PCA. iii. Identify any data points for which the scores are obviously wrong and explain why. c. Visually assess whether or not the first principal component explains the majority of the variation in the data and explain what criteria you used to make that assessment.
Step by Step Solution
There are 3 Steps involved in it
Step: 1

Get Instant Access to Expert-Tailored Solutions
See step-by-step solutions with expert insights and AI powered tools for academic success
Step: 2

Step: 3

Ace Your Homework with AI
Get the answers you need in no time with our AI-driven, step-by-step assistance
Get Started


