Question
International Investments Directions: Answer all of the questions. Must be hand-written and show all of your work/ calculations. This is not a Google assignment .

 International Investments
Directions: Answer all of the questions. Must be hand-written and show all of your work/ calculations. This is not a Google assignment . The assignment will be graded based on the standard of our textbook. (100 points)
Problem 1 is problem 22 in Chapter 12. (50 points)
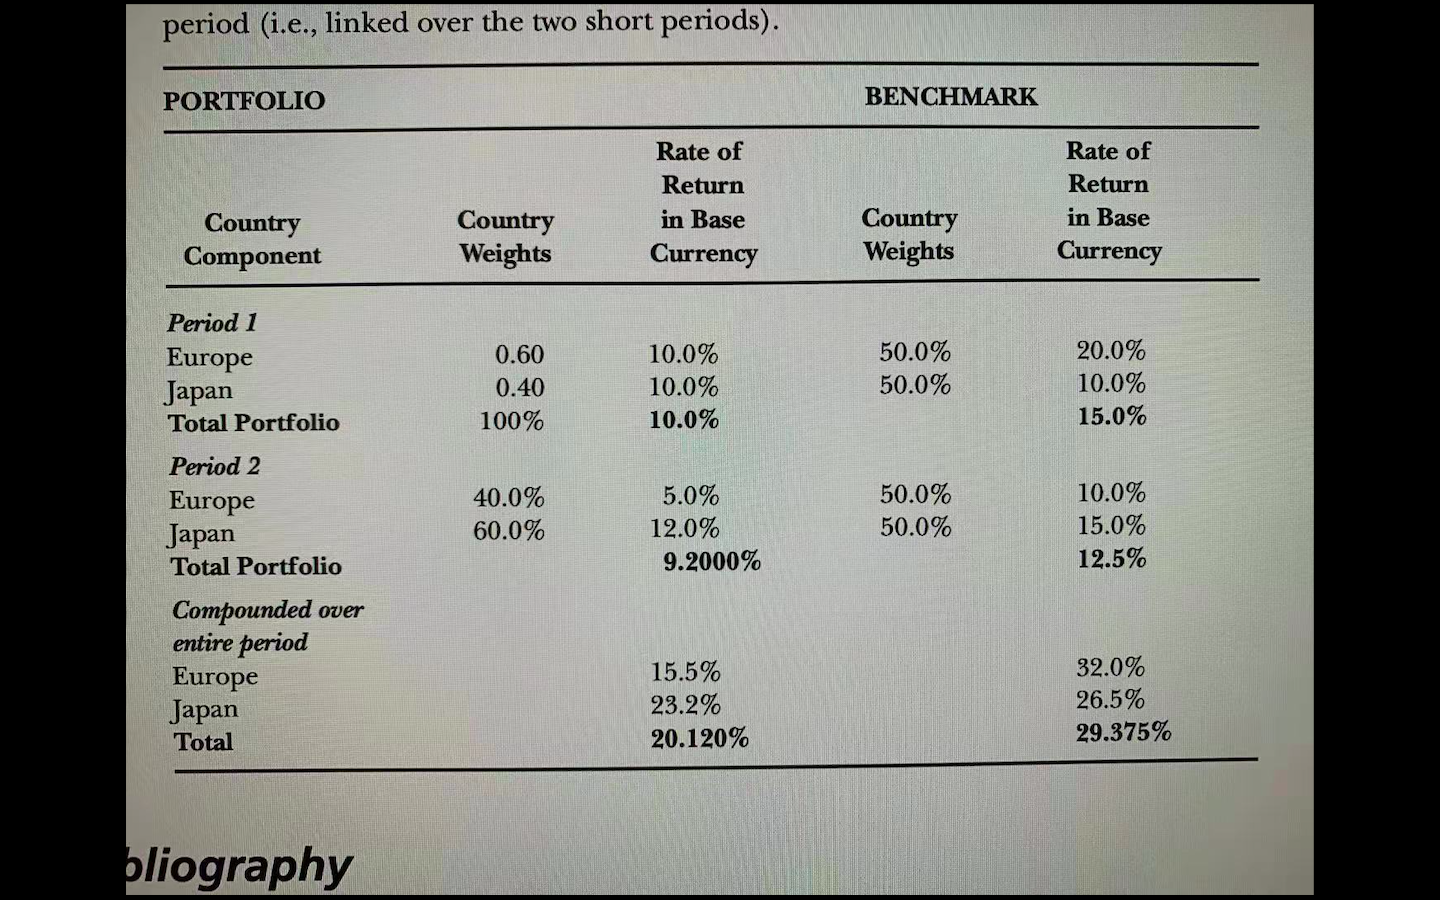
A portfolio of $100 million is invested in European and Japanese stocks at the start of period 1. The country weights in the portfolio are 60 percent in Europe and 40 percent in Japan. At the end of period 1, the portfolio value went up to $110 million. To evaluate performance, the investor uses a composite benchmark made up of 50 percent of the European equity index and 50 percent of the Japanese equity index. All calculations are performed in base currency, the U.S. dollar, and indexes are total-return indexes (dividends are reinvested). Over period 1, the European index went up by 20 percent and the Japanese index gained 10 percent, so the international benchmark gained 15 percent. Detailed return data are given below. At the end of period 1, the country allocation was changed to 40 percent in Europe and 60 percent in Japan. At the end of period 2, the portfolio was up to $120.120 million, while the composite benchmark gained 29.375 percent over the two periods.
a) Attribute the performance to security selection and market allocation for each of the two short periods: period 1 and then period 2.
b) Attribute the performance to security selection and market allocation for the total period (i.e., linked over the two short periods).
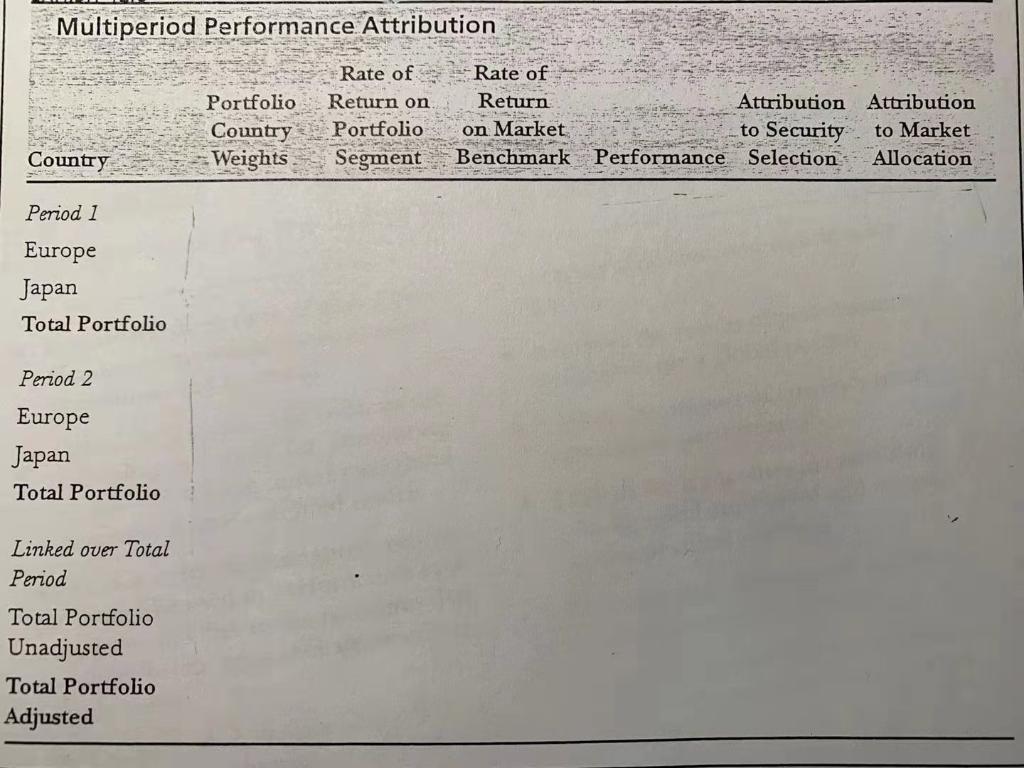
c) Fill in all of the info into the Multiperiod Performance Attribution form - some inputs will come from the data given in the problem and the rest will be based from your calculations.
period (i.e., linked over the two short periods). PORTFOLIO BENCHMARK Rate of Return in Base Currency Rate of Return in Base Currency Country Component Country Weights Country Weights Period 1 Europe Japan Total Portfolio 0.60 0.40 100% 10.0% 10.0% 10.0% 50.0% 50.0% 20.0% 10.0% 15.0% 40.0% 60.0% 5.0% 12.0% 9.2000% 50.0% 50.0% 10.0% 15.0% 12.5% Period 2 Europe Japan Total Portfolio Compounded over entire period Europe Japan Total 15.5% 23.2% 20.120% 32.0% 26.5% 29.375% bliography Multiperiod Performance Attribution Portfolio Country Weights Rate of Return on Portfolio Segment Rate of Return on Market Benchmark Attribution Attribution to Security to Market Performance Selection Allocation Country Period 1 Europe Japan Total Portfolio Period 2 Europe Japan Total Portfolio Linked over Total Period Total Portfolio Unadjusted Total Portfolio AdjustedStep by Step Solution
There are 3 Steps involved in it
Step: 1

Get Instant Access to Expert-Tailored Solutions
See step-by-step solutions with expert insights and AI powered tools for academic success
Step: 2

Step: 3

Ace Your Homework with AI
Get the answers you need in no time with our AI-driven, step-by-step assistance
Get Started


