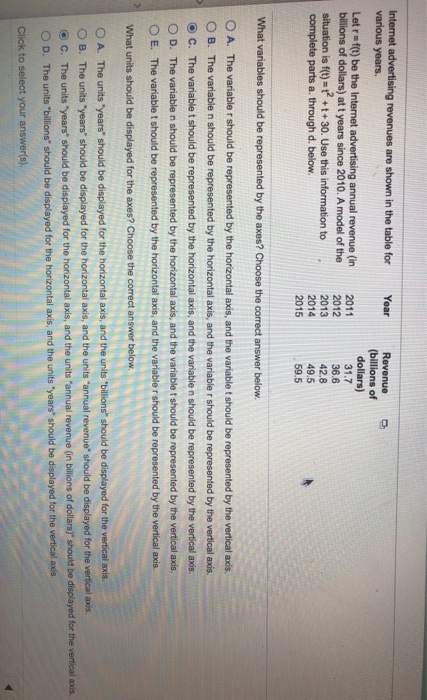
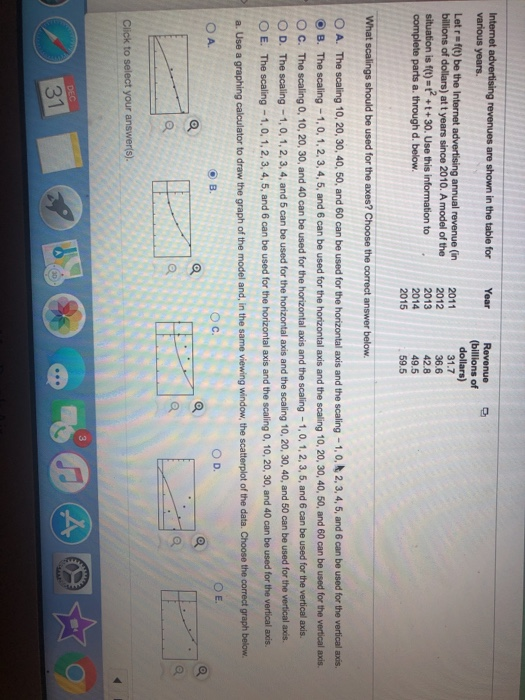
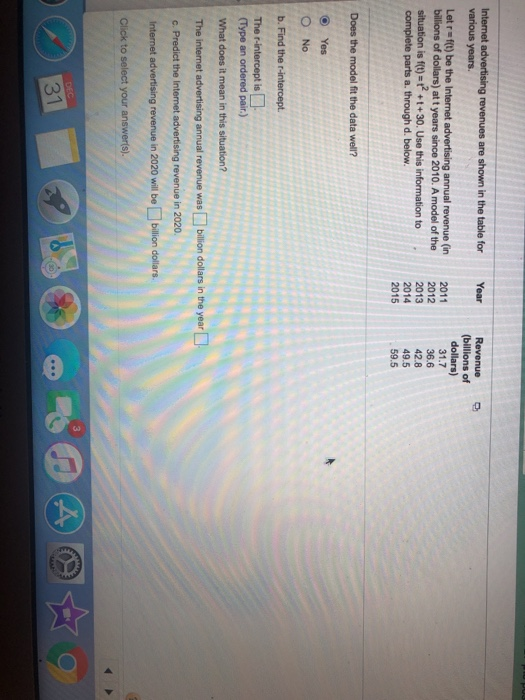
Internet advertising revenues are shown in the table for various years. Year Letraf(t) be the Internet advertising annual revenue (in billions of dollars) att years since 2010. A model of the situation is f(t)=t+ ++ 30. Use this information to complete parts a. through d. below. 2011 2012 2013 2014 2015 Revenue (billions of dollars) 31.7 36.6 42.8 49.5 59.5 What variables should be represented by the axes? Choose the correct answer below. O A. The variable r should be represented by the horizontal axis, and the variable t should be represented by the vertical axis. OB. The variable n should be represented by the horizontal axis, and the variabler should be represented by the vertical axis. O C. The variable t should be represented by the horizontal axis, and the variablen should be represented by the vertical axis. OD. The variable n should be represented by the horizontal axis, and the variable t should be represented by the vertical axis. O E. The variablet should be represented by the horizontal axis, and the variabler should be represented by the vertical axis. What units should be displayed for the axes? Choose the correct answer below. O A. The units "years" should be displayed for the horizontal axis, and the units "billions" should be displayed for the vertical axis. OB. The units "years should be displayed for the horizontal axis, and the units annual revenue should be displayed for the vertical axis. OC. The units "years should be displayed for the horizontal axis, and the units annual revenue (in billions of dollars)" should be displayed for the vertical axis O D. The units "billions should be displayed for the horizontal axis, and the units "years should be displayed for the vertical axis. Click to select your answer(s). Internet advertising revenues are shown in the table for various years. Year Letr=f(t) be the Internet advertising annual revenue (in billions of dollars) att years since 2010. A model of the situation is f(t)=1? ++ 30. Use this information to complete parts a through d. below. 2011 2012 2013 2014 2015 Revenue (billions of dollars) 31.7 36.6 42.8 49.5 59.5 What scalings should be used for the axes? Choose the correct answer below. O A. The scaling 10, 20, 30, 40, 50, and 60 can be used for the horizontal axis and the scaling - 1,0, 2, 3, 4, 5, and 6 can be used for the vertical axis. O B. The scaling - 1,0, 1, 2, 3, 4, 5, and 6 can be used for the horizontal axis and the scaling 10, 20, 30, 40, 50, and 60 can be used for the vertical axis. O C. The scaling 0, 10, 20, 30, and 40 can be used for the horizontal axis and the scaling - 1,0, 1, 2, 3, 5, and 6 can be used for the vertical axis. O D. The scaling -1,0, 1, 2, 3, 4, and 5 can be used for the horizontal axis and the scaling 10, 20, 30, 40, and 50 can be used for the vertical axis. O E. The scaling - 1,0, 1, 2, 3, 4, 5, and 6 can be used for the horizontal axis and the scaling 0, 10, 20, 30, and 40 can be used for the vertical axis. a. Use a graphing calculator to draw the graph of the model and, in the same viewing window, the scatterplot of the data. Choose the correct graph below. C OD. OE OA Click to select your answer(s). DEG 31 Internet advertising revenues are shown in the table for various years. Year o Letra f(t) be the Internet advertising annual revenue (in billions of dollars) at t years since 2010. A model of the situation is f(t)=1? ++ 30. Use this information to complete parts a. through d. below. 2011 2012 2013 Revenue (billions of dollars) 31.7 36.6 42.8 49.5 59.5 Does the model fit the data well? Yes O No b. Find ther-intercept. Ther-interceptis (Type an ordered pair.) What does it mean in this situation? The internet advertising annual revenue was billion dollars in the year c. Predict the Internet advertising revenue in 2020. Internet advertising revenue in 2020 will be billion dollars. Click to select your answer(s). 0 Conds) at years since 2010. A model of the situation is f(t) = 1 + 30. Use this information to complete parts a through d. below. 2011 2012 2013 2014 2015 on on b. Find the r-intercept. Ther-interceptis (Type an ordered pair) What does it mean in this situation? The internet advertising annual revenue was billion dollars in the year c. Predict the Internet advertising revenue in 2020. Internet advertising revenue in 2020 will be billion dollars. d. Estimate when Internet advertising annual revenue will be 86 billion The Internet advertising annual revenue will be 86 billion in the year Click to select your answer(s)