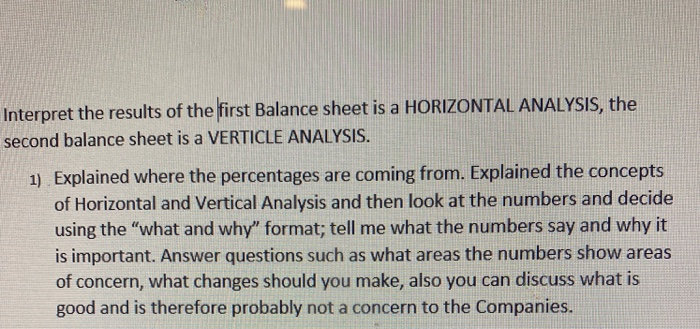
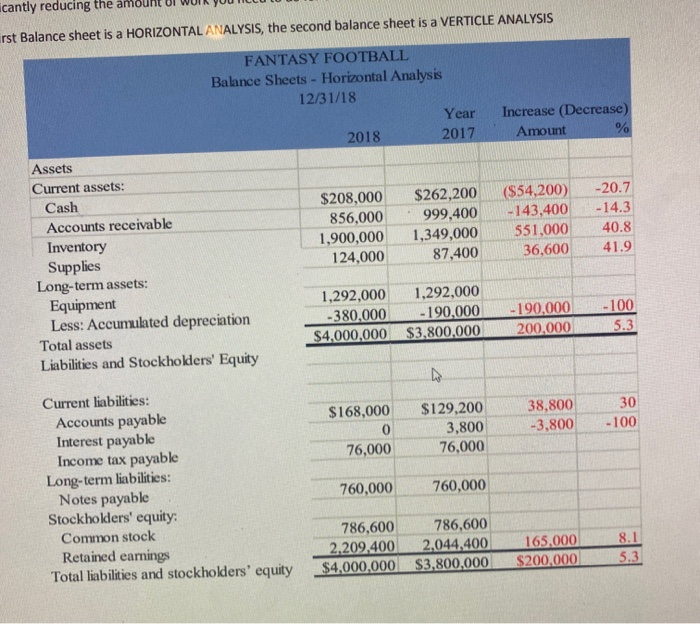
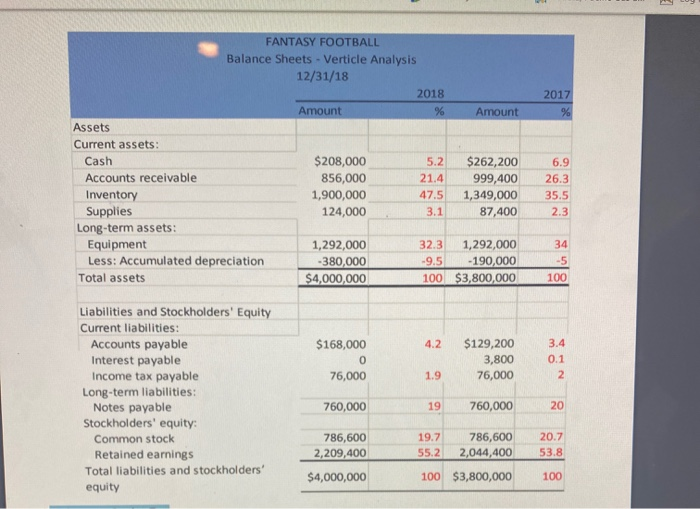
Interpret the results of the first Balance sheet is a HORIZONTAL ANALYSIS, the second balance sheet is a VERTICLE ANALYSIS. 1) Explained where the percentages are coming from. Explained the concepts of Horizontal and Vertical Analysis and then look at the numbers and decide using the "what and why" format; tell me what the numbers say and why it is important. Answer questions such as what areas the numbers show areas of concern, what changes should you make, also you can discuss what is good and is therefore probably not a concern to the Companies. cantly reducing the an rst Balance sheet is a HORIZONTAL ANALYSIS, the second balance sheet is a VERTICLE ANALYSIS Increase (Decrease) Amount % FANTASY FOOTBALL Balance Sheets - Horizontal Analysis 12/31/18 Year 2018 2017 Assets Current assets: Cash $208,000 $262,200 Accounts receivable 856,000 999,400 Inventory 1,900,000 1,349,000 Supplies 124,000 87,400 Long-term assets: Equipment 1,292,000 1.292,000 Less: Accumulated depreciation -380,000 - 190,000 Total assets $4,000,000 $3,800,000 Liabilities and Stockholders' Equity ($54,200) -143,400 551,000 36,600 -20.7 - 14.3 40.8 41.9 - 190,000 200,000 -100 5.3 $168,000 $129,200 3,800 76,000 38,800 -3,800 30 - 100 76,000 Current liabilities: Accounts payable Interest payable Income tax payable Long-term liabilities: Notes payable Stockholders' equity: Common stock Retained earnings Total liabilities and stockholders' equity 760,000 760,000 786,600 786,600 2,209.400 2,044,400 $4,000,000 $3,800,000 165.000 $200,000 8.1 5.3 2017 % FANTASY FOOTBALL Balance Sheets - Verticle Analysis 12/31/18 2018 Amount %6 Amount Assets Current assets: Cash $208,000 5.2 $262,200 Accounts receivable 856,000 21.4 999,400 Inventory 1,900,000 47.5 1,349,000 Supplies 124,000 3.1 87,400 Long-term assets: Equipment 1,292,000 32.3 1,292,000 Less: Accumulated depreciation -380,000 -9.5 -190,000 Total assets $4,000,000 100 $3,800,000 6.9 26.3 35.5 2.3 34 -5 100 4.2 $168,000 0 76,000 $129,200 3,800 76,000 3.4 0.1 2 1.9 Liabilities and Stockholders' Equity Current liabilities: Accounts payable Interest payable Income tax payable Long-term liabilities: Notes payable Stockholders' equity: Common stock Retained earnings Total liabilities and stockholders' equity 760,000 19 760,000 20 20.7 53.8 786,600 2,209,400 $4,000,000 19.7 786,600 55.2 2,044,400 100 $3,800,000 100


