Answered step by step
Verified Expert Solution
Link Copied!

Question

1 Approved Answer

Interpreting the Statement of Cash Flows. Sunbeam Corporation manufactures and sells a variety of small household appliances, including toasters, food processors, and waffle grills. Exhibit

Interpreting the Statement of Cash Flows. Sunbeam Corporation manufactures and sells a variety of small household appliances, including toasters, food processors, and waffle grills. Exhibit 3.21 presents a statement of cash flows for Sunbeam for Year 5, Year 6, and Year 7. After experiencing decreased sales in Year 5, Sunbeam hired Albert Dunlap in Year 6 to turn the company around. Albert Dunlap, known in the industry as Chainsaw Al, had previously directed restructuring efforts at Scott Paper Company. The restructuring effort at Sunbeam generally involved firing employees and cutting costs aggressively. Most of these restructuring efforts took place during Year 6. The market expected significantly improved results in Year 7. Reported sales increased 18.7% between Year 6 and Year 7, and net income improved. However, subsequent revelations showed that almost half of the sales increase resulted from fraudulent early recognition of revenues in the fourth quarter of Year 7 that the firm should have recognized in the first quarter of Year8. Growth in revenues for Years 5, 6, and 7 was 2.6%, 3.2%, and 18.7%, respectively.

Required

a. Using the information provided and the statement of cash flows for Year 5 in Exhibit3.21, identify any signals that Sunbeam was experiencing operating difficulties and was in need of restructuring.

b. Using information in the statement of cash flows for Year 6, identify indicators of the turnaround efforts and any relations among cash flows that trouble you.

c. Using information in the statement of cash flows for Year 7, indicate any signals that the firm might have engaged in aggressive revenue recognition and had not yet fixed its general operating problems.
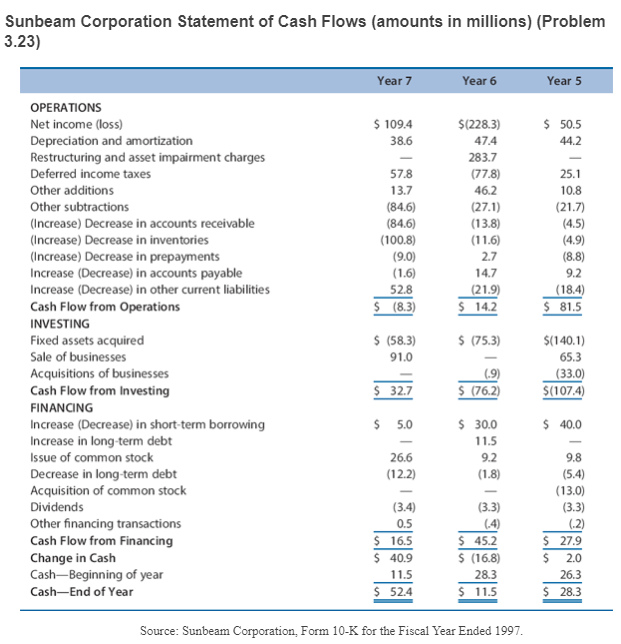
image text in transcribed

Sunbeam Corporation Statement of Cash Flows (amounts in millions) (Problem 3.23) Year 7 Year 6 Year 5 $ 109.4 $ 50.5 44.2 38.6 57.8 13.7 (84.6) (84.6) (100.8) (9.0) (1.6) 52.8 $ (8.3) $(228.3) 47.4 283.7 (77.8) 46.2 (27.1) (13.8) (11.6) 2.7 14.7 (21.9) $ 14.2 25.1 10.8 (21.7) (4.5) (4.9) (8.8) 9.2 (18.4) $ 81.5 $ (75.3) OPERATIONS Net income (loss) Depreciation and amortization Restructuring and asset impairment charges Deferred income taxes Other additions Other subtractions (Increase) Decrease in accounts receivable (Increase) Decrease in inventories (Increase) Decrease in prepayments Increase (Decrease) in accounts payable Increase (Decrease) in other current liabilities Cash Flow from Operations INVESTING Fixed assets acquired Sale of businesses Acquisitions of businesses Cash Flow from Investing FINANCING Increase (Decrease) in short-term borrowing Increase in long-term debt Issue of common stock Decrease in long-term debt Acquisition of common stock Dividends Other financing transactions Cash Flow from Financing Change in Cash Cash-Beginning of year Cash-End of Year $ (58.3) 91.0 $(140.1) 65.3 (33.0) $(107.4) (9) $ (76.2) $ 32.7 $ 5.0 $ 40.0 $ 30.0 11.5 9.2 (1.8) 26.6 (12.2) (3.3) (3.4) 0.5 $ 16.5 $ 40.9 11.5 $ 52.4 9.8 (5.4) (13.0) (3.3) (2) $ 27.9 $ 2.0 26.3 $ 28.3 $ 45.2 $ (16.8) 28.3 $ 11.5 Source: Sunbeam Corporation Form 10-K for the Fiscal Year Ended 1997. Sunbeam Corporation Statement of Cash Flows (amounts in millions) (Problem 3.23) Year 7 Year 6 Year 5 $ 109.4 $ 50.5 44.2 38.6 57.8 13.7 (84.6) (84.6) (100.8) (9.0) (1.6) 52.8 $ (8.3) $(228.3) 47.4 283.7 (77.8) 46.2 (27.1) (13.8) (11.6) 2.7 14.7 (21.9) $ 14.2 25.1 10.8 (21.7) (4.5) (4.9) (8.8) 9.2 (18.4) $ 81.5 $ (75.3) OPERATIONS Net income (loss) Depreciation and amortization Restructuring and asset impairment charges Deferred income taxes Other additions Other subtractions (Increase) Decrease in accounts receivable (Increase) Decrease in inventories (Increase) Decrease in prepayments Increase (Decrease) in accounts payable Increase (Decrease) in other current liabilities Cash Flow from Operations INVESTING Fixed assets acquired Sale of businesses Acquisitions of businesses Cash Flow from Investing FINANCING Increase (Decrease) in short-term borrowing Increase in long-term debt Issue of common stock Decrease in long-term debt Acquisition of common stock Dividends Other financing transactions Cash Flow from Financing Change in Cash Cash-Beginning of year Cash-End of Year $ (58.3) 91.0 $(140.1) 65.3 (33.0) $(107.4) (9) $ (76.2) $ 32.7 $ 5.0 $ 40.0 $ 30.0 11.5 9.2 (1.8) 26.6 (12.2) (3.3) (3.4) 0.5 $ 16.5 $ 40.9 11.5 $ 52.4 9.8 (5.4) (13.0) (3.3) (2) $ 27.9 $ 2.0 26.3 $ 28.3 $ 45.2 $ (16.8) 28.3 $ 11.5 Source: Sunbeam Corporation Form 10-K for the Fiscal Year Ended 1997

Step by Step Solution

There are 3 Steps involved in it

Step: 1

blur-text-image

Get Instant Access to Expert-Tailored Solutions

See step-by-step solutions with expert insights and AI powered tools for academic success

Step: 2

blur-text-image

Step: 3

blur-text-image

Ace Your Homework with AI

Get the answers you need in no time with our AI-driven, step-by-step assistance

Get Started

Recommended Textbook for

Towards A Socioanalysis Of Money Finance And Capitalism Beneath The Surface Of The Financial Industry

Authors: Susan Long , Burkard Sievers

1st Edition

041571060X,1136666672

More Books

Students also viewed these Finance questions

Question

using signal flow graph

Answered: 1 week ago