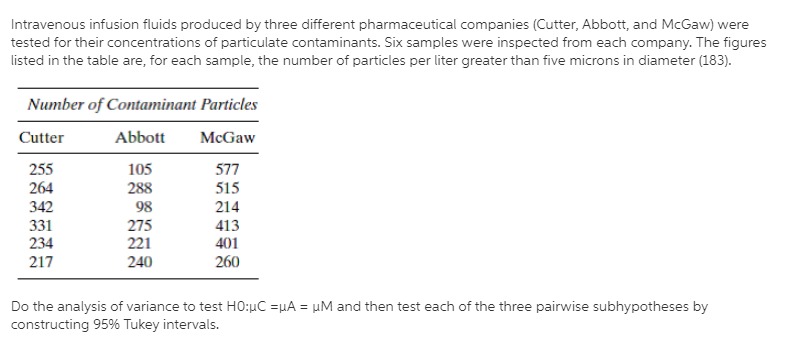
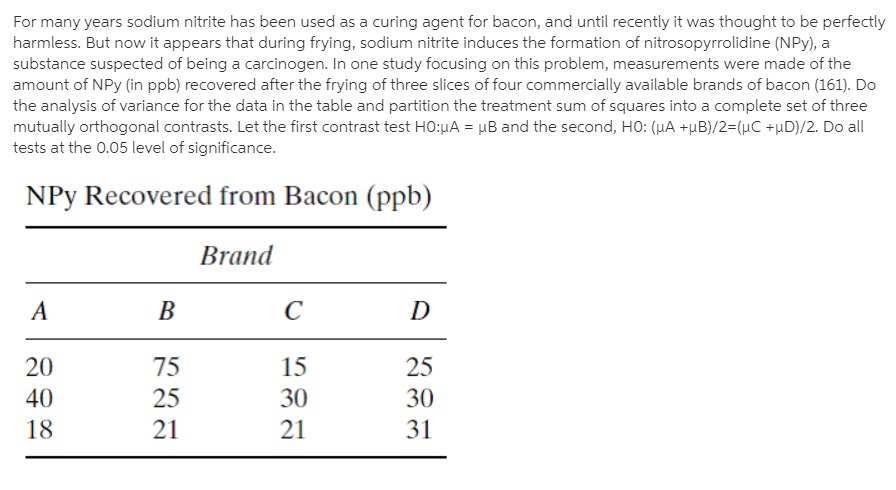
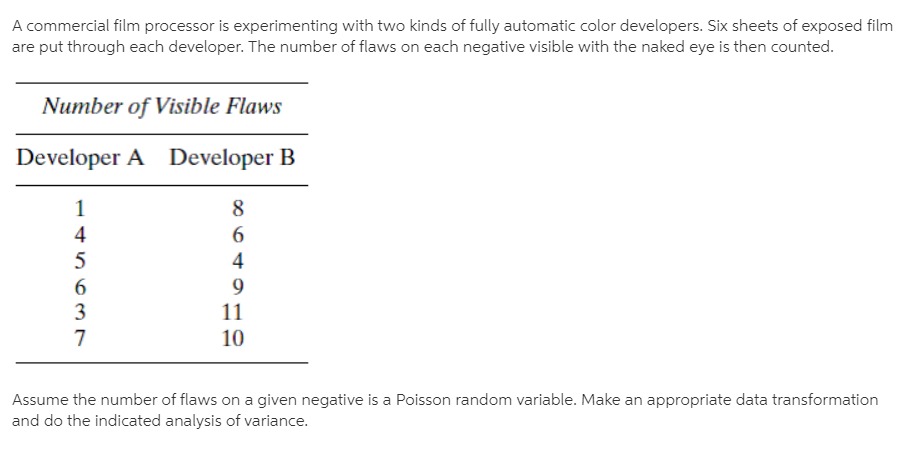
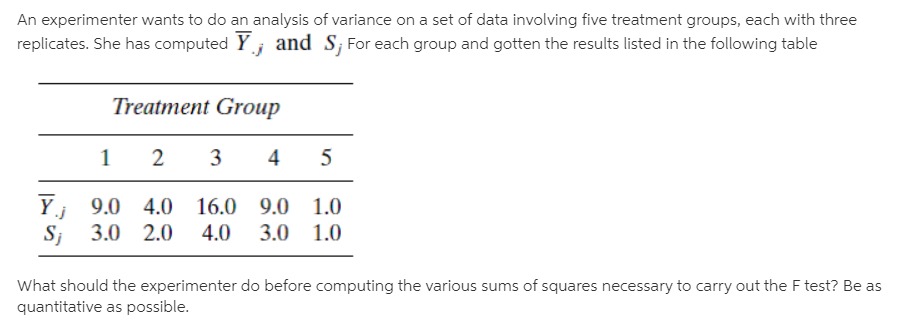
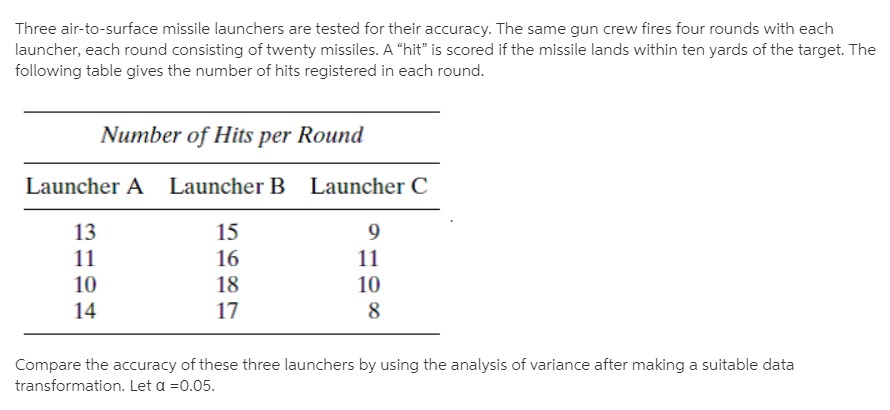
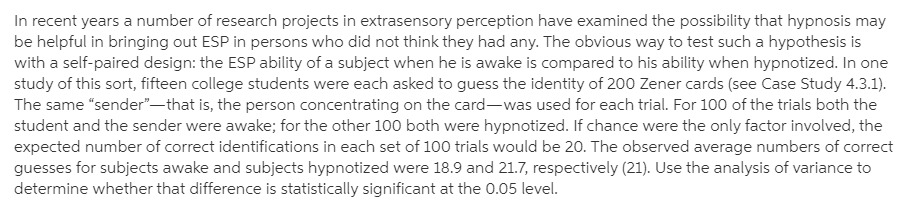
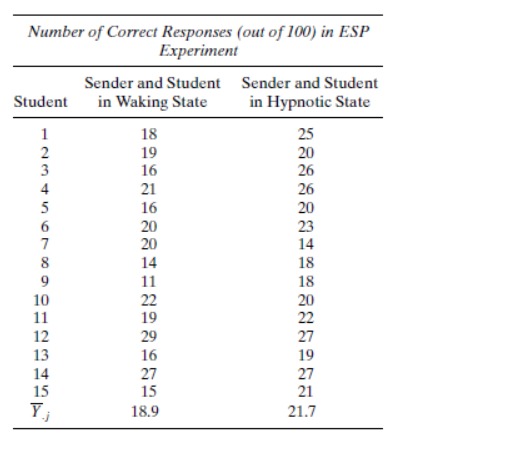
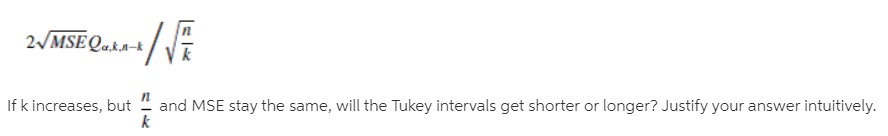
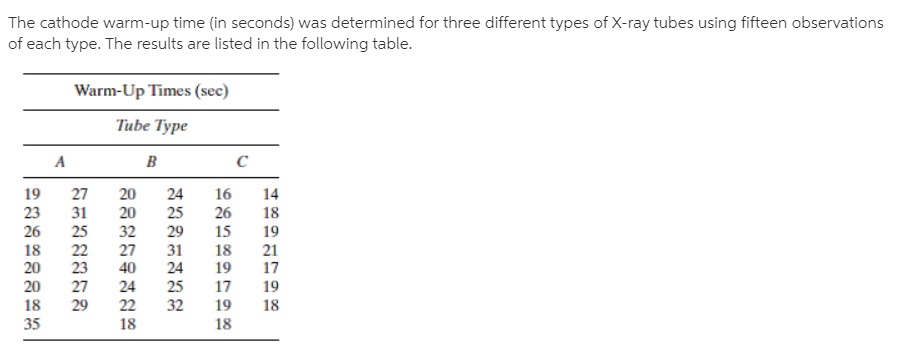
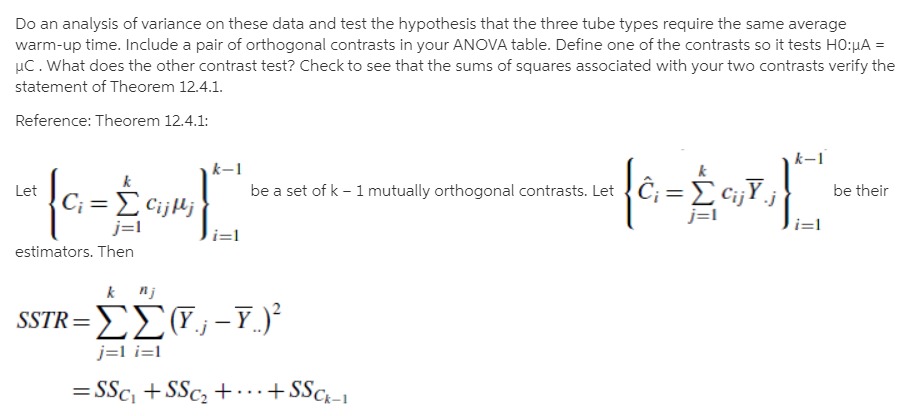
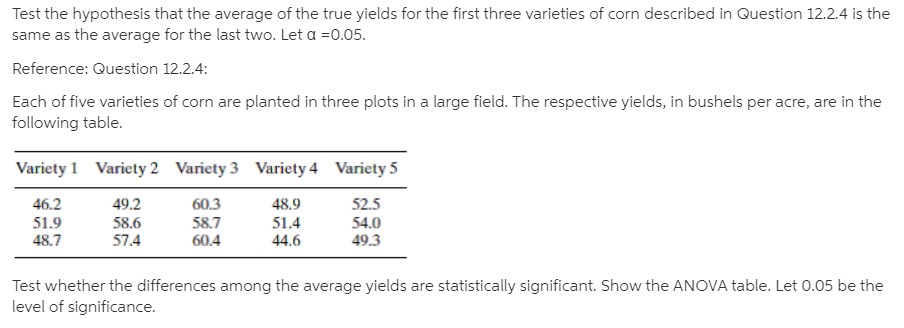
Intravenous infusion fluids produced by three different pharmaceutical companies (Cutter, Abbott, and McGaw) were tested for their concentrations of particulate contaminants. Six samples were inspected from each company. The figures listed in the table are, for each sample, the number of particles per liter greater than five microns in diameter (183). Number of Contaminant Particles Cutter Abbott McGaw 255 105 577 264 288 515 342 98 214 331 275 413 234 221 401 217 240 260 Do the analysis of variance to test HO:UC =UA = UM and then test each of the three pairwise subhypotheses by constructing 95% Tukey intervals.For many years sodium nitrite has been used as a curing agent for bacon. and untii recently it was thought to be perfectly harmless. But now it appears that during frying, sodium nitrite induces the formation of nitrosopyrrolidine [N Py}, a substance suspected of being a carcinogen. in one study focusing on this problem. measurements were made of the amount of NPy [in ppb} recovered after the frying of three slices of four commercially availabie brands of bacon {161}. Do the anaiysis of variance for the data in the table and partition the treatment sum of squares into a complete set of three mutuailyr orthogonal contrasts. Let the first contrast test HORN-K = HS and the second. H0: {LEA +uB}!2=I{|.1C +pDii'2. Do all tests at the 0.05 level of significance. NPy Recovered from Bacon (ppb) Brand A B C D 20 75 15 25 40 25 3D 30 18 21 21 31 A commercial film processor is experimenting with two kinds of fully automatic color developers. Six sheets of exposed film are put through each developer. The number of flaws on each negative visible with the naked eye is then counted. Number of Visible Flaws Developer A Developer B JWaUAL Assume the number of flaws on a given negative is a Poisson random variable. Make an appropriate data transformation and do the indicated analysis of variance.An experimenter wants to do an analysis of variance on a set of data involving five treatment groups, each with three replicates. She has computed Y , and S; For each group and gotten the results listed in the following table Treatment Group 1 2 3 4 5 Y ; 9.0 4.0 16.0 9.0 1.0 Sj 3.0 2.0 4.0 3.0 1.0 What should the experimenter do before computing the various sums of squares necessary to carry out the F test? Be as quantitative as possible.Three airtosurface missile iaunchers are tested fortheir accuracy. The same gun crew res four rounds with each launcher, each round consisting of twenty missiles. A \"hit\" is scored if the missile lands within ten yards of the target. The following table gives the number of hits registered in each round. Number of Hits per Round Launcher A Launcher B Launcher C 13 15 9 ll 16 11 ID 18 10 14 17 8 Compare the accuracy of these three launchers by using the analysis of variance after making a suitable data transformation. Let 0 =0.05. In recent years a number of research projects in extrasensory perception have examined the possibility that hypnosis may be helpful in bringing out ESP in persons who did not thinkthey had any. The obvious way to test such a hypothesis is with a selfpaired design: the ESP ability ofa subject when he is awake is compared to his ability when hypnotized. In one study of this sort, fifteen college students were each asked to guess the identity of 20C} Zener cards (see Case Study 4.3.1}. The same \"sender\"that isr the person concentrating on the cardwas used for each trial. For 100 of the trials both the student and the sender were awake; for the other 100 both were hypnotized. If chance were the only factor involved, the expected number of correct identifications in each set of 100 trials would be 20. The observed average numbers of correct guesses for subjects awake and subjects hypnotized were 18.9 and 21.7, respectively [21). Use the analysis of variance to determine whether that difference is statistically significant at the 0.05 level. Number of Correct Responses (out of 100) in ESP Experiment Sender and Student Sender and Student Student in Waking State in Hypnotic State 18 25 19 20 16 26 21 26 16 20 16 19 14 27 15 15 21 Y.j 18.9 21.7A comparison was made of the efficiency of four different unit-dose injection systems. A group of pharmacists and nurses were the "blocks." For each system, they were to remove the unit from its outer package, assemble it, and simulate an injection. In addition to the standard system of using a disposable syringe and needle to draw the medication from a vial, the other systems tested were Vari-Ject (CIBAPharmaceutical), Unimatic (Squibb), and Tubex (Wyeth). Listed in the following table are the average times (in seconds) needed to implement each of the systems (149). Average Times (sec) for Implementing Injection Systems Subject Standard Vari-Ject Unimatic Tubex T 35.6 17.3 24.4 25.0 102.3 31.3 16.4 22.4 26.0 96.1 36.2 18.1 22.8 25.3 102.4 31.1 17.8 21.0 24.0 93.9 39.4 18.8 23.3 24.2 105.7 34.7 17.0 21.8 26.2 99.7 34.1 14.5 23.0 24.0 95.6 36.5 17.9 24.1 20.9 99.4 32.2 14.6 23.5 23.5 93.8 10 40.7 16.4 31.3 36.9 125.3 351.8 168.8 237.6 256.0 1014.2 (a) Test the equality of the means at the 0.05 level. (b) Use Tukey's method to test all six pairwise differences of the four uj 's. Let a =0.05. (Note: SSTOT = 2056.10, SST R = 1709.60, and SSB = 193.53; Q.05,4,27 =4.34.)Heart rates were monitored [10} for six tree shrews [Tupaia glis} during three different stages of sleep: LSWS [light slow wave sleep], DSWS (deep slowwave sleep], and REM [rapideyemovement sleep]. Hem Rule: (MINOR!!!) 'I'teeShrew LSWS DSWS REM 14.1 1 1.? 15.? 26.0 21.1 21 .5 21.9 19.? 18.3 19.0 18.2 17.0 26.! 23.2 22.5 205 2a.? 13.9 G'UI-I-HNI-i {a} Do the analysis of variance to test the equality of the heart rates during these three phases of sleep. Let CI =0.05. [b] Because of the marked physiological difference between REM sleep and LSWS and DSWS sleep, it was decided before the data were collected to test the REM rate against the average of the other two. Test the appropriate subhypothesis with a contrast. Use the 0.05 level of significance. Also, nd a second contrast orthogonal to the first and verify that the sum of the sum of squares for the two contrasts equals SSTR. Construct 95% Tukey intervals for all ten pairwise differences, ui -uj , for the data of Question 12.2.4. Summarize the results by plotting the five sample averages on a horizontal axis and drawing straight lines under varieties whose average yields are not significantly different. Reference: Question 12.2.4 Each of five varieties of corn are planted in three plots in a large field. The respective yields, in bushels per acre, are in the following table. Variety 1 Variety 2 Variety 3 Variety 4 Variety 5 46.2 49.2 60.3 48,9 52.5 51.9 58.6 58.7 51.4 54.0 48.7 57.4 60.4 44.6 49.3 Test whether the differences among the average yields are statistically significant. Show the ANOVA table. Let 0.05 be the level of significance.Construct 95% Tukey intervals for all ten pairwise differences. pi ui , for the data of Question 12.2.4. Summarize the results by plotting the five sample averages on a horizontal axis and drawing straight lines under varieties whose average yields are not significantly different. Each of five varieties of corn are planted in three plots in a large eld. The respective yields, in bushels per acre. are in the following table. Variety 1 Variety 2 Variety 3 Variety4 Variety 5 46.2 49.2 60.3 48.9 52.5 51.9 58.6 58.1 51.4 54.0 43.? 5'14 60.4 44.6 493 Test whetherthe differences among the average yields are statistically significant. Show the ANO'VA table. Let 0.05 be the level of significance. Construct 95% Tukey condence intervals for the three pairwise differences associated with the murder culpability scores described in Question 8.2.15.Which differences are statistically significant? Reference: Question 8.2.15: For Questions 82.1382.32 identify the experimental design [onesample. twosample. etc.]I that each set of data represents. Nine political writers were asked to assess the United States' culpabiiityr in murders committed by revolutionary groups financed by the CIA. Scores were assigned using a scale of 0 to 100. Three of the writers were native Americans living in the United States. three were native Americans living abroad, and three were foreign nationals. Americans in us. Americans Abroad Foreign Nationals 65 3'5 50 9O 55 85 8&& 2mg.....4/'/ If k increases, but '2 and MSE stay the same. will the Tukey intervals get shorter or longer? Justify your answer intuitively. I; The cathode warmup time [in seconds} was determined for three different types of Xray tubes using fifteen observations of each type. The results are listed in the following tabie. Warm-Up Times (sec) Tub: Type A B C 19 27 20 24 16 14 23 Si 20 25 26 18 26 2'5 32 29 15 19 18 2'2 27 3] 18 21 2|] 23 40 24 19 17 2|] 2? 24 P5 1? 19 IE 29 22 32 19 18 35 18 13 Do an analysis of variance on these data and test the hypothesis that the three tube types require the same average warm-up time. Include a pair of orthogonal contrasts in your ANOVA table. Define one of the contrasts so it tests HO:JIA = HC . What does the other contrast test? Check to see that the sums of squares associated with your two contrasts verify the statement of Theorem 12.4.1. Reference: Theorem 12.4.1: k-1 k-1 Let k ci = [ cijt; be a set of k - 1 mutually orthogonal contrasts. Let be their i=1 i=1 estimators. Then k nj SSTR = j=1 i=1 = SSC +SSc2 + ...+ SSCk-1Test the hypothesis that the average of the true yields for the first three varieties of corn described in Question 12.2.4 is the same as the average for the last two. Let a =0.05. Reference: Question 12.2.4: Each of five varieties of corn are planted in three plots in a large field. The respective yields, in bushels per acre, are in the following table. Variety 1 Variety 2 Variety 3 Variety 4 Variety 5 46.2 49.2 60.3 48.9 52.5 51.9 58.6 58.7 51.4 54.0 48.7 57.4 60.4 44.6 49.3 Test whether the differences among the average yields are statistically significant. Show the ANOVA table. Let 0.05 be the level of significance.Large companies have the option of limiting their growth. but does doing so lead to higher profitability? The table below gives the protability for a sample of twentyone topranked companies, where profitability is expressed in terms of annual prot as a percentage of total company assets. The rms are divided into three groups by size of assets$50 billion or less, between $51 and $100 billion, and over $100 billion. Test the hypothesis that small and medium-size companies are as protable as large companies. Let Ci =O.10. Size of Assets (billions of 3) $50 or Less Between $51 and $100 Greater than $100 7.2 1 1.3 14.8 6.5 5.6 1 1.3 5.7 5.3 9.2 4.4 5.3 4.8 3.4 10.4 3.9 3.4 6.2 10.2 7.8 5.3 7.3 (Note: SSE: 14117429}