

Answered step by step
Verified Expert Solution
Question
1 Approved Answer
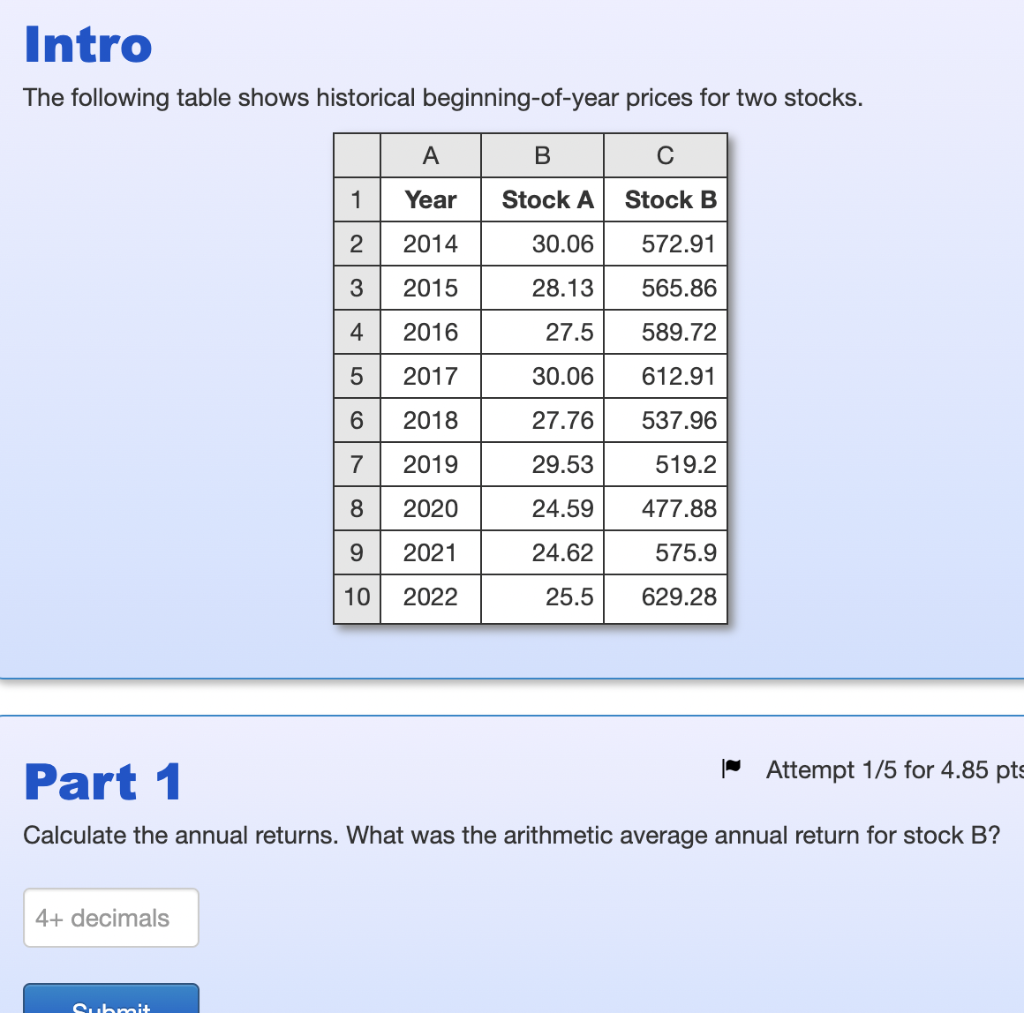
Intro The following table shows historical beginning-of-year prices for two stocks. A B 1 Year Stock A Stock B 2 2014 30.06 572.91 3 2015
Step by Step Solution
There are 3 Steps involved in it
Step: 1

Get Instant Access to Expert-Tailored Solutions
See step-by-step solutions with expert insights and AI powered tools for academic success
Step: 2

Step: 3
Ace Your Homework with AI
Get the answers you need in no time with our AI-driven, step-by-step assistance
Get Started
The Future Of Pricing How Airline Ticket Pricing Has Inspired A Revolution
Authors: E. Boyd
1st Edition
0230600190,0230606903