

Intro The risk-free asset pays a return of rF=0.5%. There are 3 risky assets: A, B and C. The expected returns and variances of
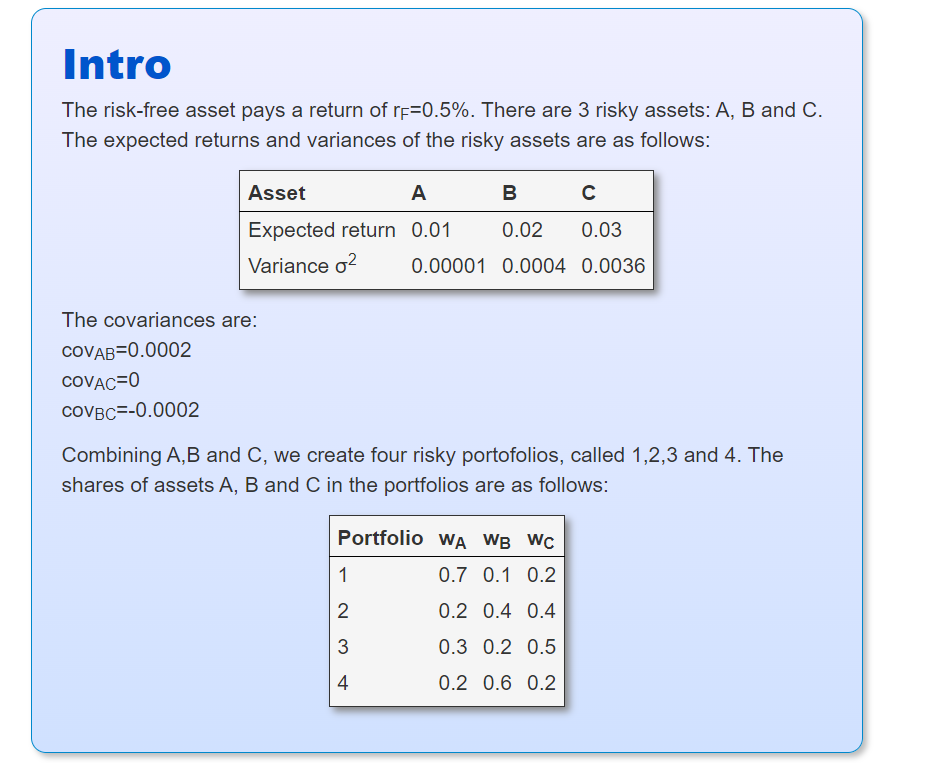
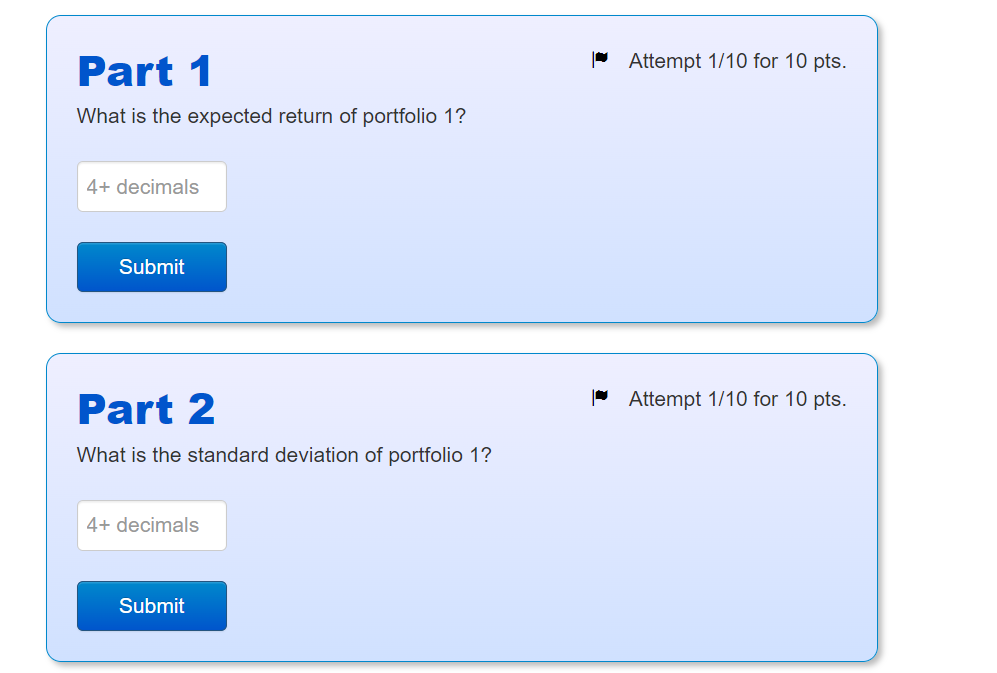
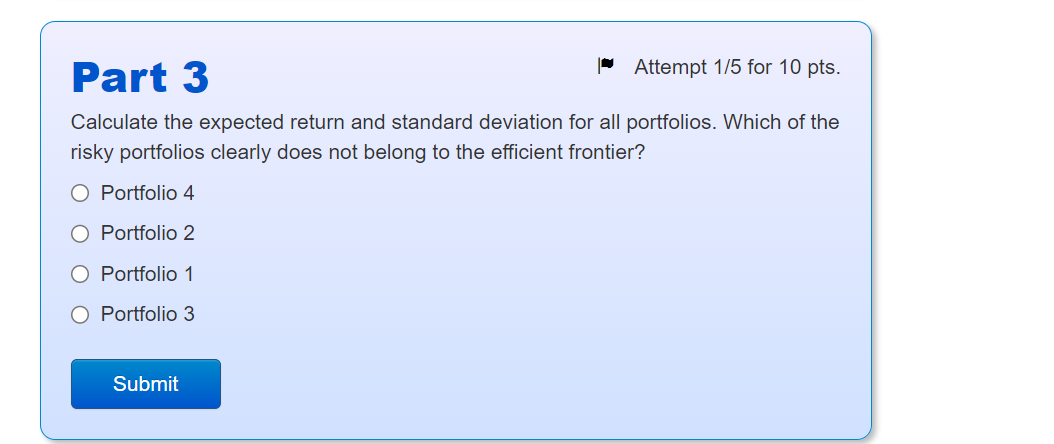
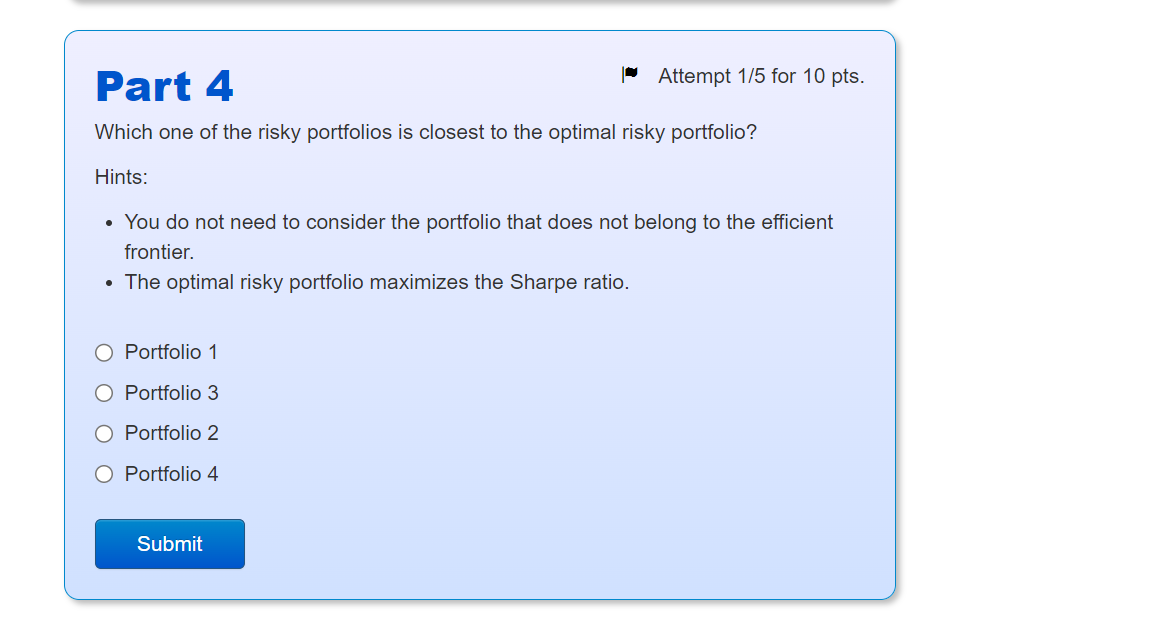
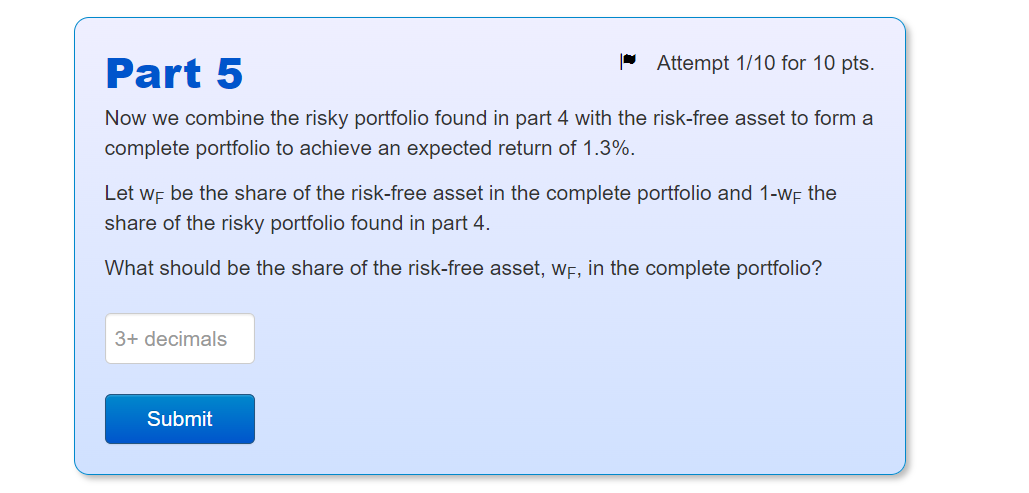

Intro The risk-free asset pays a return of rF=0.5%. There are 3 risky assets: A, B and C. The expected returns and variances of the risky assets are as follows: Asset A Expected return 0.01 Variance o The covariances are: COVAB=0.0002 COVAC=0 COVBC=-0.0002 B 0.02 0.03 0.00001 0.0004 0.0036 Combining A, B and C, we create four risky portofolios, called 1,2,3 and 4. The shares of assets A, B and C in the portfolios are as follows: Portfolio WA WB WC 0.7 0.1 0.2 1 2 3 4 0.2 0.4 0.4 0.3 0.2 0.5 0.2 0.6 0.2 Part 1 What is the expected return of portfolio 1? 4+ decimals Submit Part 2 What is the standard deviation of portfolio 1? 4+ decimals Submit Attempt 1/10 for 10 pts. Attempt 1/10 for 10 pts. Attempt 1/5 for 10 pts. Part 3 Calculate the expected return and standard deviation for all portfolios. Which of the risky portfolios clearly does not belong to the efficient frontier? Portfolio 4 Portfolio 2 Portfolio 1 O Portfolio 3 Submit Part 4 Which one of the risky portfolios is closest to the optimal risky portfolio? Hints: Attempt 1/5 for 10 pts. You do not need to consider the portfolio that does not belong to the efficient frontier. The optimal risky portfolio maximizes the Sharpe ratio. Portfolio 1 Portfolio 3 Portfolio 2 O Portfolio 4 Submit Part 5 Now we combine the risky portfolio found in part 4 with the risk-free asset to form a complete portfolio to achieve an expected return of 1.3%. Attempt 1/10 for 10 pts. Let WF be the share of the risk-free asset in the complete portfolio and 1-w- the share of the risky portfolio found in part 4. What should be the share of the risk-free asset, WF, in the complete portfolio? 3+ decimals Submit Part 6 Finally, what is the share of asset A in the complete portfolio that you determined in part 5? 3+ decimals Attempt 1/10 for 10 pts. Submit Problem 4 Intro You have $7,000 to invest. You've done some security analysis and generated the following data for three stocks and Treasury bills, including weights in the optimal risky portfolio (ORP) from doing Markowitz portfolio optimization: Security Expected return (%) Variance Beta Weight in ORP (%) Stock A Stock B Stock C 12 7 5 0.04 0.03 0.02 1.2 1.5 0.8 48 18 34 T-bills 4 0 0 0 Part 1 If you want to achieve an expected return of 7% for the complete portfolio, how much money should you invest in stock B (in $)? 0+ decimals Submit Attempt 3/10 for 10 pts. 0+ decimals Part 2 What is the ratio of the Sharpe ratio of the complete portfolio to the Sharpe ratio of the ORP? Submit Attempt 2/10 for 10 pts.
Step by Step Solution
3.60 Rating (161 Votes )
There are 3 Steps involved in it
Step: 1
Part 1 Expected Return of Portfolio 1 The expected return of a portfolio is the weighted average of the expected returns of the assets in the portfolio The formula is E R p w A E R A w B E R B w C E R ... View full answer

Get step-by-step solutions from verified subject matter experts
100% Satisfaction Guaranteed-or Get a Refund!
Step: 2Unlock detailed examples and clear explanations to master concepts

Step: 3Unlock to practice, ask and learn with real-world examples
See step-by-step solutions with expert insights and AI powered tools for academic success
-
 Access 30 Million+ textbook solutions.
-
Ask unlimited questions from AI Tutors.
-
Order free textbooks.
-
100% Satisfaction Guaranteed-or Get a Refund!
Claim Your Hoodie Now!
Authors: Robert Thornton Morrison, Robert Neilson Boyd
6th Edition
8120307208, 978-8120307209

Study Smart with AI Flashcards
Access a vast library of flashcards, create your own, and experience a game-changing transformation in how you learn and retain knowledge
Explore Flashcards

