

Answered step by step
Verified Expert Solution
Question
1 Approved Answer
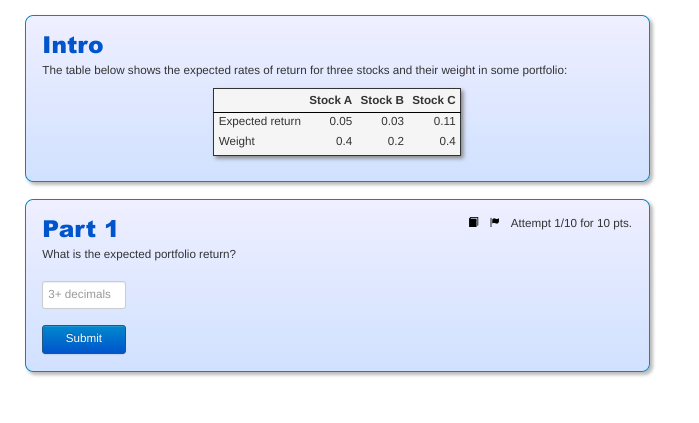
Intro The table below shows the expected rates of return for three stocks and their weight in some portfolio: Stock A Stock B Stock C
Step by Step Solution
There are 3 Steps involved in it
Step: 1

Get Instant Access to Expert-Tailored Solutions
See step-by-step solutions with expert insights and AI powered tools for academic success
Step: 2

Step: 3
Ace Your Homework with AI
Get the answers you need in no time with our AI-driven, step-by-step assistance
Get Started
Investment The Study Of An Economic Aggregate
Authors: Philip J. Lund
1st Edition
0444851380,1483256901