

Question
Introduction In the section you were complete a few questions just to get you thinking about trigonometric functions look like and how they behave. A.)
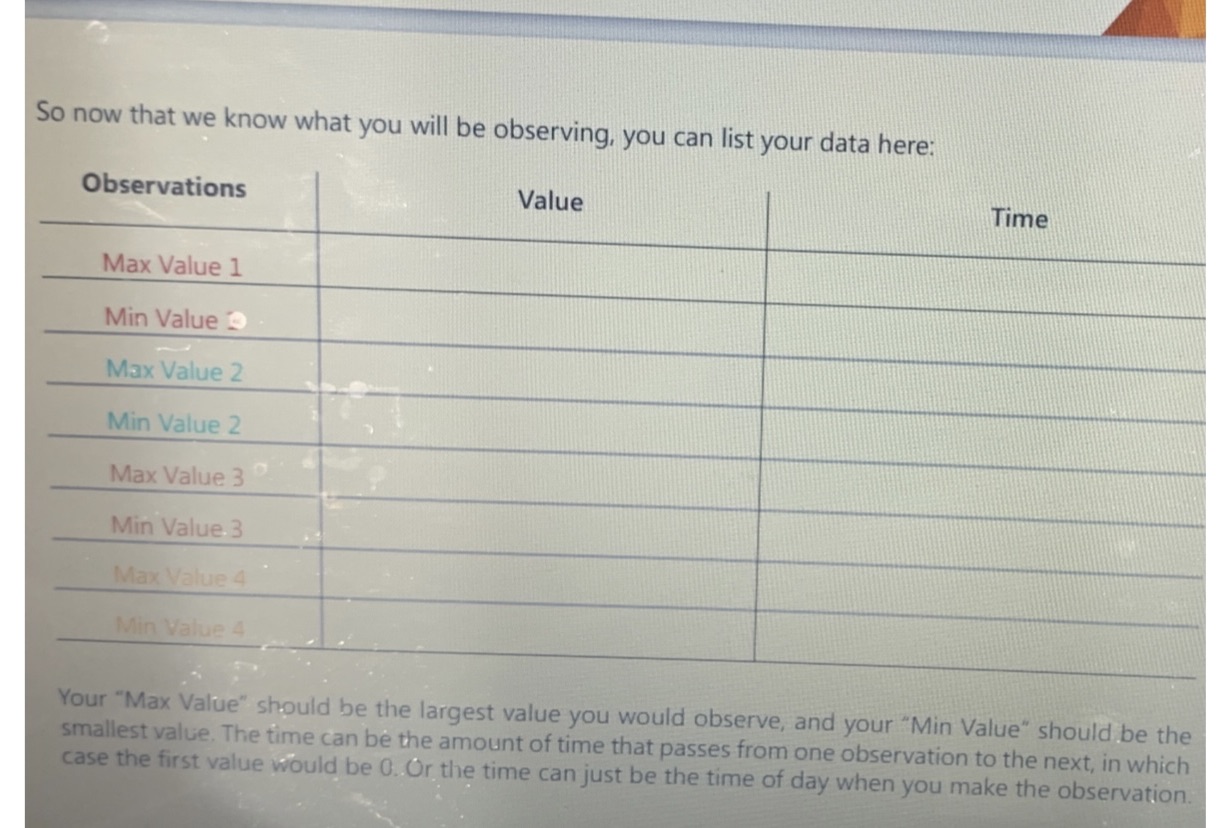
Introduction In the section you were complete a few questions just to get you thinking about trigonometric functions look like and how they behave. A.) f(x)= sin(x)B.) f(x)= cos(x)So now we know what the general sine and cosine graphs look like, we can begin to describe them. They both squiggle back and forth between Y values of one and negative one. What is the main difference between these two graphs?Now there are other aspects of trigonometric functions, such as amplitude, period, vertical displacement, and phase shift. Let's describe each parameter and how they affect the shape and behavior of the graph.Amplitude:Period:Vertical displacement:Phase shift:PredictionsSpoiler alert, in this project you will be modeling your very own trigonometric function after something you observe in your daily life. So how do you think you'd go about that? If you were tasked with collecting data that could follow a trigonometric function, describe your procedure here: Once we have our data, describe how you think you take your observations and transform them into trigonometric function here:What problems do you predict running into when modeling your data into trigonometric function? Do you think your data will fit perfectly into an equation? Why or why not?In the next section we looking at what collecting data will look like and the real procedure for creating the trigonometric function that it models. Experiment In the section of the project, we will be collecting data from observations in order to make our very own trigonometric function. But before we do that, let's quickly go over what a trigonometric function is and does so that we understand what we are trying to observe.Trigonometry functions, such as the sine function or cosine function create repetitive, wave like graphs that bounce back-and-forth between a maximum and minimum value. This works well when we are dealing with some thing that happens repetitively over a certain period of time, in which case for y= f(x), we have that the "x" variable is the time and the "y" variable is the value of what we are observing. So in order to make a function model as accurately as we can there are few guidelines we should follow.1.) since trigonometric functions oscillate (or fluctuate) Between two values, these values should be the same over each period of function. That is the maximum value should always remain quite consistent, as shit the minimum value.2.) The time between observation should be relatively equal. This time is known as the period of the function, and if it changes from observation to observation we end up with a lopsided graph which is more difficult to accurately model.3.) You should be observing the highest and the lowest values that your variable can take it's much more difficult to model something if you're only taking an average value over the duration of the observations.this makes it pretty impossible to find those maximum and minimum values we need in order to form a proper trigonometric function. So now that we know our guidelines for how and what we should be observing for the experiment, we can begin thinking about the possible things to collect data on. Some examples are daily high and low temperatures, the percentage of the visible moon over the 27 day moon cycle, etc... Describe what you are observing here(give a description of the time between observations as well): So now that we know what you will be observing you can list your data here: Model Now that we have our data, we can begin to model it into trigonometric function. We find our amplitude,period, and vertical displacement from our observations. Do we use a sine or cosine function? Well that's up to you what would be easier if you used your max value at times zero? Just some things to think about when making your equation.Amplitude: Period: Vertical displacement: Your equation should be in the form: f(x) = asin(bx) + c f(x) = acos(bx) + cEquation: ?>ReflectionDid you choose to model your data using a sine or cosine function? Why?Use your newfound function to find certain maximum or minimum values at the times you observed while collecting your data. Do these values exactly match your observations? If not describe why your function is not 100% accurateIf you were to use the first maximum observed value at time, t = 0 (which you may have done), how does that simplify the trigonometric function?If you were to do this project over again, what would you do differently and why?

Step by Step Solution
There are 3 Steps involved in it
Step: 1

Get Instant Access to Expert-Tailored Solutions
See step-by-step solutions with expert insights and AI powered tools for academic success
Step: 2

Step: 3
Ace Your Homework with AI
Get the answers you need in no time with our AI-driven, step-by-step assistance
Get Started
Mathematical Logic Foundations For Information Science
Authors: Wei Li
2nd Edition
3034808623, 9783034808620