

Question
Introduction It is early 2006, and Martin Harris, Alliance Concrete's new CFO, is asked to provide a valuation of the company, which needs to include
Introduction
It is early 2006, and Martin Harris, Alliance Concrete's new CFO, is asked to provide a valuation of the company, which needs to include a careful analysis of possible changes in economic drivers behind the valuation of the company. In order to do so, Harris has to build up a valuation model from scratch, based on a number of assumptions, in order to calculate future free cash flows and the appropriate discount rate.
Purpose
This real-world case involving a relatively straightforward valuation of a firm allows students to apply concepts such as free cash flows, planning horizons, required rate of return, valuation of privately held companies, and the link between growth, margins, and value.
Getting Started
Alliance Concrete was a small ready-mix concrete producer in Michigan's northern Lower Peninsula. The company operated 14 mixing plants and owned a fleet of 240 mixing trucks. Its customers were predominantly in the residential and commercial construction industry with some additional sales related to road construction and repair. The company had been extremely successful, with substantial revenue and income growth over the last few years driven by a strong residential real estate market. Although Alliance was purchased in 2006 by National Industrial Supplies, a Canadian construction conglomerate with assets in both the United States and Canada, it continued to operate as a separate legal entity.
For Martin Harris, Alliance's chief financial officer, late January 2006 was the best of times and the worst of times. Harris had been recently promoted to this position after the departure of some of Alliance's senior management upon the completion of the acquisition. His first major task was to forecast Alliance's operations for the coming year. What he discovered was that despite strong growth and profitability, Alliance was going to find itself short on cash. This meant the company would have to skip a dividend to the parent company, miss a principal repayment to its bank, or defer much-needed capital investments. Harris was able to renegotiate the principal repayment with Alliance's bank, who agreed to reset Alliance's borrowing limit to an amount greater than their current outstanding loan. In the subsequent conversations with Alliance's parent company, Harris successfully argued for making the full capital improvements recommended by his plant manager, which meant a slightly smaller than anticipated dividend.
As Harris finished the conference call with National's executive team in which he outlined his plans for the coming year, his immediate supervisor asked him to do "just one more thing"-specifically, to provide an estimate of the value of Alliance. National had spent $150 million to acquire Alliance just 10 months ago. It was suddenly clear to Harris that in arguing for the capital investments and negotiating a reduction in the anticipated dividend, he may have raised concerns that National had overpaid for Alliance. He was now going to have to address these concerns. Unfortunately, Harris had played only a small role in those negotiations, and was not familiar with the assumptions that gave rise to that price. He would have to build his valuation from the ground up.
Next Year's Financial Statement Forecast
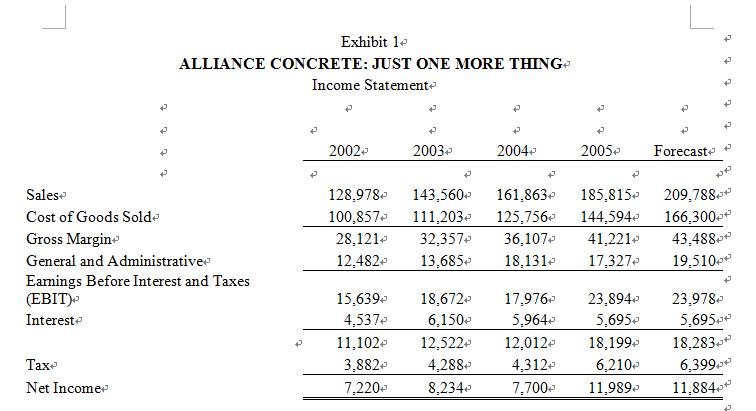
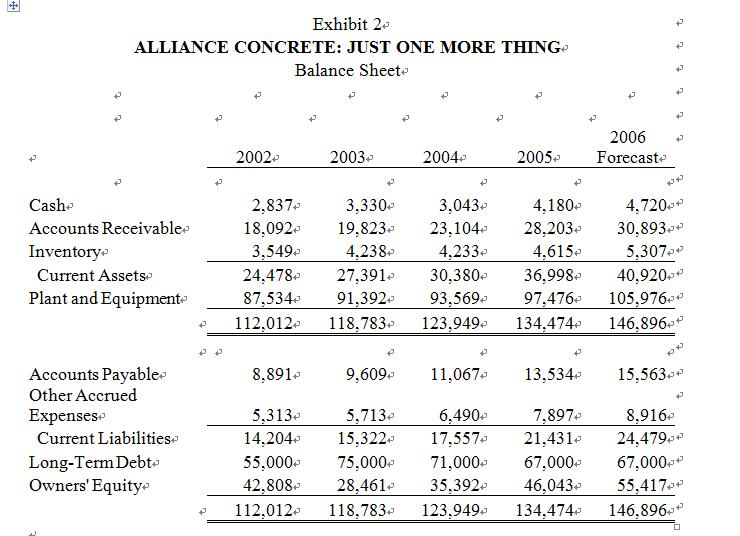
As a starting point for his valuation, Harris had the agreed-upon forecast for the coming year. The forecasted income statement and balance sheet are presented in an Excel workbook, along with the past years' results, in Exhibit 1 and Exhibit 2, respectively. To address the valuation request, Harris needed a longer horizon forecast. He approached his staff for their thoughts.
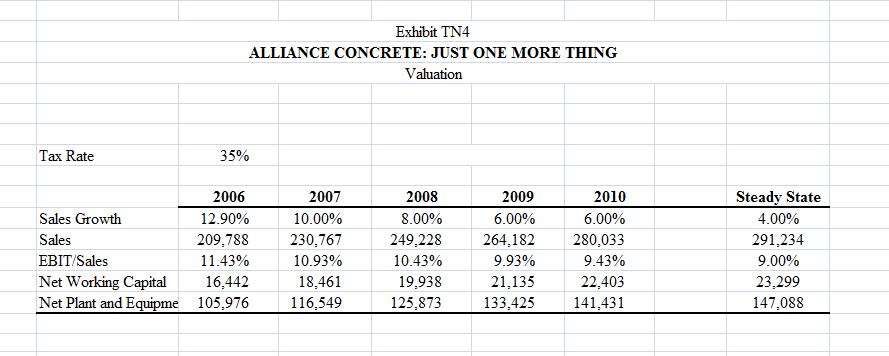
The sales manager recognized a slowdown was quite likely. His expected sales growth for 2007 and 2008 would be 10% and 8% respectively. After that he was pretty much guessing, but when pressed he thought 6% was reasonable. He noted that if sales simply kept pace with long-term economic growth, it would imply about 4% growth per year.
Despite numerous discussions regarding costs with his staff, it was difficult to arrive at any consensus. Most of the staff believed the last four years had been particularly good ones and realistically expected margins (i.e., EBIT/sales) to tighten after 2007. Based on his discussions, Harris believed margins would erode by 0.5% each year over the period of 2007 to 2010. For the long-run, he expected margins similar to the industry level, which would be an EBIT-to-Sales ratio of 9%.
As for investments in plant and equipment, the plant manager continued to argue that plant and equipment were in need of improvement. Just how much was hard to determine. He was quite clear, however, that even with the large capital expenditures approved for 2006, the company had still not invested enough and there could be production problems.
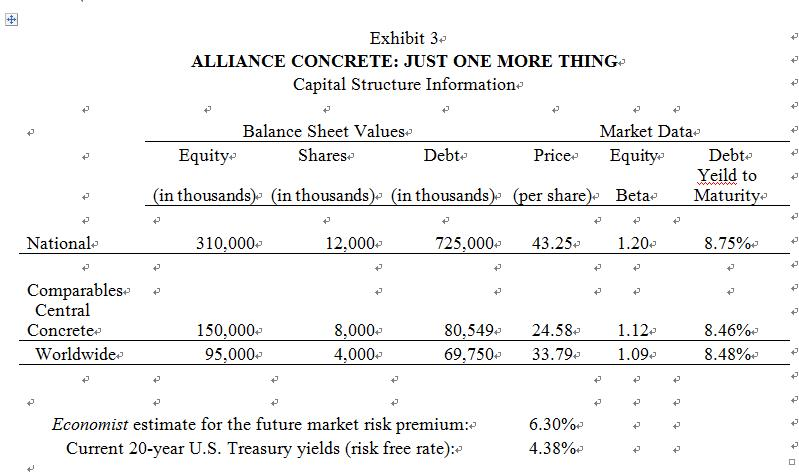
Finding an appropriate discount rate was also a challenge. Alliance had always been privately held and there was little information on the owners' required returns, let alone any market information. The capital structure of the company was a moving target-management had borrowed substantially in the past and had been paying down its debt since then. Alliance currently paid 8.5% interest on its borrowings. To provide additional insights, Harris had his assistant gather information on two publicly held companies that were in businesses much like Alliance's, though located in different parts of the country. Harris also had a memo from National that described its capital structure and provided market information. All that information is summarized in Exhibit 3 in the Excel workbook.
Valuation
With all the information gathered, Harris began to build his valuation model. While putting together the base-case valuation was going to be something of a challenge, he was even more nervous about what variations on the analysis he should consider. Clearly, there were growing concerns about an economic slowdown and this would attenuate near-term growth. He was also unsure about what level of plant and equipment was needed. Finally, he was very uncomfortable with the scant information he had with which to derive a discount rate.
1. Calculate the WACC for the two comparable concrete firms and for National. Which of these rates (or combination) is the most appropriate for valuing Alliance?
2. Calculate the free cash flow expected from Alliance over 2006 (based on the forecast for 2006).
3. Calculate free cash flow for the next four years (2007-2010), based on the forecast for 2006 and information from the Alliance staff.
4. Provide an estimate of the terminal value of Alliance, assuming that the cash flows after that point grow steadily at the long-term growth rate. Note that investments in the net working capital (NOWC) and property, plant, and equipment (PP&E) must be calculated from the change in those account balances.
5. Provide an estimate of the enterprise value of Alliance.
Step by Step Solution
There are 3 Steps involved in it
Step: 1

Get Instant Access to Expert-Tailored Solutions
See step-by-step solutions with expert insights and AI powered tools for academic success
Step: 2

Step: 3
Ace Your Homework with AI
Get the answers you need in no time with our AI-driven, step-by-step assistance
Get Started
Liars Poker Rising Through The Wreckage On Wall Street
Authors: Michael Lewis
1st Edition
0393246108,0393247147