

Question
Introduction Thad Lepp, chief operating officer at Superior Engineering Services (SES), thumbed through the regional sales report for 2013. On the whole, it looked as
Introduction Thad Lepp, chief operating officer at Superior Engineering Services (SES), thumbed through the regional sales report for 2013. On the whole, it looked as though the worst was over. Sales were up in every region except for the Midwest, but the Texas figures were troubling. Despite the Lone Star State's potential, Superior had been unable to penetrate the market there in any meaningful way. T exas was contributing only 2% of company revenues. It had been almost 10 years since Superior opened offices in San Antonio and Fort Worth. How much longer should the company work to cultivate this market? Was there enough of an upside to warrant staying the course? Should Superior jettison this market to focus in areas closer to its base of operations in North Carolina? These were questions that would certainly come up when Superior's executive team held its regular quarterly meeting. The Engineering Services Industry The engineering services industry provided studies, design, construction management, and consulting for facilities in support of all sectors of the economy (e.g., residential, commercial, government, transportation, healthcare, education). The industry was active within all developed (and some undeveloped) portions of the United States. The engineering services industry consisted of many small companies that typically restricted their activities to regional markets, while larger firms had a global presence. The industry was fragmented with the four largest firms controlling less than 14% of the industry sales. Despite the low concentration, the 50 largest firms generated approximately 40% of industry sales. As the recession deepened and construction projects plunged, many small firms were forced to cease operations. The industry was further fragmented by over 90,000 self-employed professionals; however, they constituted only a very small proportion of industry sales. The industry was highly dependent on the real estate and government segments of the U.S. economy. Construction activity and sales declined during the recession beginning in 2007 and continued through 2013 largely due to cuts implemented due to government sequestration. Since 2011, the industry had shown signs of recovery as businesses began to invest in new facilities. However, the federal government scaled back spending on capital projects. Competition was high due to the large number of competitors within the industry.
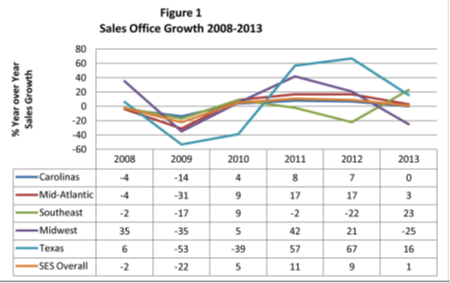
Clients typically made their purchase decision for engineering services based on reputation for service and quality, experience on previous projects, and price. The demand for engineering services in the United States consisted of industrial and manufacturing projects, transportation, commercial, federal, government, residential, project management, and municipal utilities (Edwards, 2015). The T exas market had added 24,000 construction jobs as of August 2013, roughly 14% of the 168,000 added nationwide. Job growth in Dallas, Houston, and Austin was twice the national average. Furthermore, in 2013, three of the top 10 U.S. metro markets with the highest number of housing starts were in Texas (Avila, 2013). Superior Engineering Services Superior Engineering Services' (SES) headquarters was in Holly Springs, North Carolina, just outside Raleigh. The employee-owned company, founded in 1987, grew to include 45 locations with just over 1,100 employees by 2014. The offices were primarily along the Eastern seaboard (Florida to Pennsylvania), but it also had offices in Indiana, Ohio and Texas. The company services spanned geotechnical, environmental, and facilities engineering and construction materials testing. For example, in widening one city's beltway, Superior provided geotechnical engineering and inspection for drilled shafts and retaining walls. For the reconstruction of a fire-damaged building, the company provided petrographic analysis of concrete columns and load testing of existing pile foundations. Services it provided to a metro rail project included construction materials testing and quality control of drilled shafts. The company's clients included architects and engineers, facility owners, and general contractors, as well as the state, local, and the federal government. Thad knew that the "Texas question" was not as straightforward as the numbers might indicate. Superior's recent executive meeting illustrated the complexities of the situation. One of the standing agenda items was a report from each business unit on its financial and non-financial status. After Barney Williams, regional manager of the Texas operation, gave yet another report laced with more red than black ink, the room grew silent. Was someone going to comment, or would they be able to avoid unpleasantness? Not surprisingly, the Mid-Atlantic manager, Mike Mangione, asked "How much more money de we need to lose before we cut our losses?" He grabbed a copy of the Texas balance sheet and pointed to the negative shareholders equity. "After all these years, we're still running a $1 million deficit in retained earnings, and that doesn't even include the personal injury litigation we settled for $3 million," he continued. Seeing his chance, Phil Collins, the Florida regional manager, said "Texas is too far from any of our other operations, making the span of control difficult. Furthermore, we can't seem to convince any of our most experienced managers to take on the challenge of turning it around." It went downhill from there. The CEO, Mike Matthews, launched into his defense of the Texas operation with a lecture on the great potential offered by the state, an apology for some early tactical errors, and an affirmation of his commitment to stick it out in Texas. All the regional managers looked relieved when Mike's executive assistant announced that lunch had arrived. The call to lunch had broken the tension, but managers continued the discussion in small groups around the restrooms and in the buffet line. Thad made a mental note that this scene was like the 1993 movie Groundhog Dayall over again, except that at Superior, the situation never improved?the Texas question came up again and again. Before the afternoon session began, Thad scanned Superior's rather erratic sales growth (See Figure 1).
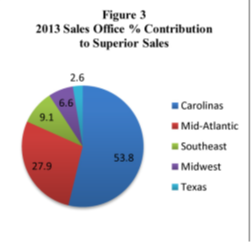
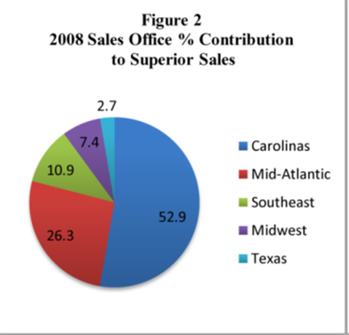
Growth percentages for Texas varied, with some higher and some lower than those at other offices over the same time period but on a much smaller dollar sales volume. Superior's total sales for 2013 were over $119 million, but the Texas operation had never contributed more than $3.1 million to company sales. Furthermore, profits were nonexistent for the Texas operation with the average net profit margin being a negative 16% from 2007-2013. Losses since 2010 had been getting smaller with the net profit margin reaching a high of ?1.5% for 2013. Figures 2and 3show the contributions to sales by the various sales offices in both 2008 and 2013. The basic contributions provided by each office had remained relatively consistent over the time period.
Figure 2. 2008 Sales Office Percent Contribution to Superior Sales showing the percentage contribution of Superior's regional offices to the company's total sales. Texas contributed only 2.7 % in 2008, while the Carolina office contributed 52.9 %.
Figure 3. 2013 Sales Office Percent Contribution to Superior Sales. Source:Adapted from information provided by the company. Note:Figure 3shows the contributions by each office for the 2013 year. T exas contributed 2.6% and the Carolina office 53.8%. SAGE Woody Richardson, Kenneth Machande & Peter O'Hara 2016SAGE Business CasesPage 6 of 9Superior Engineering in Texas: Stay or Go?
Thad scanned Superior's selected financials (see Table 1) hoping to gain further insight into the Texas question. As he glanced at the figures, he wondered how much would actually be saved by eliminating the T exas operation. For example, it wasn't clear to Thad whether the Texas branch managers would be reassigned or terminated. His best guess based on the CEO's comments in defense of the Texas operation was that only one manager would be retained, at a cost of about $140,000. The equipment used in Texas was getting older, and the cost of transporting it to a new location would probably be more than it was worth. Thad thought it could be disposed of at its book value. Thad seemed to recall that this was the last year of the lease and that negotiations to extend it would occur next quarter. Since each branch operated essentially as a strategic business unit (SBU) Thad knew that Superior would not need to reabsorb any of the overhead costs or business development (BD) and marketing attributed to the Texas branch. Likewise, the other income associated with Texas would be eliminated.
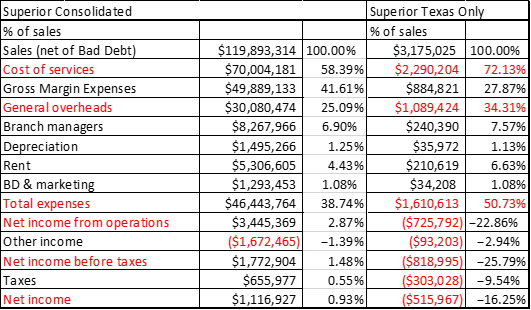
Table 1. Superior Engineering Services: 2013 Selected Financials, showing the income statement for Superior as a whole and the income statement for Texas only. Superior Consolidated Superior Texas Only Sales (net of bad debt) $119,893,314 $3,175,025 SAGE Woody Richardson, Kenneth Machande & Peter O'Hara 2016SAGE Business CasesPage 7 of 9Superior Engineering in Texas: Stay or Go?
Cost of services $70,004,181 $2,290,204 Gross margin $49,889,133 $884,821 Expenses General overheads $30,080,474 $1,089,424 Branch managers $8,267,966 $240,390 Depreciation $1,495,266 $35,972 Rent $5,306,605 $210,619 BD & marketing $1,293,453 $34,208 Total expenses $46,443,764 $1,610,613 Net income from operations $3,445,369 $(725,792) Other income $(1,672,465) $(93,203) Net income before taxes $1,772,904 $(818,995) Taxes $655,977 $(303,028) Net income $1,116,927 $(515,967) Source:Adapted from information provided by the company. Note:Superior's sales totaled $119.8M with just over $1M net income. Texas generated just over $3M in sales producing a loss of $515,967.
As Thad made his way back into the conference room, he seemed to have more questions than when the day began. Texas might be a huge contributor to Superior's bottom line one day, but when? Were the losses incurred over the10-year effort in Texas relevant to going forward? What other numbers might help Thad and the other Superior executives make a decision on resolving the Texas question?
What would the Texas branch's financials look like if it maintained Superior's overall gross margin?

Step by Step Solution
There are 3 Steps involved in it
Step: 1

Get Instant Access to Expert-Tailored Solutions
See step-by-step solutions with expert insights and AI powered tools for academic success
Step: 2

Step: 3
Ace Your Homework with AI
Get the answers you need in no time with our AI-driven, step-by-step assistance
Get Started
Welcome To Hospitality An Introduction
Authors: Kaye Kye-Sung Chon, Thomas A. Maier
3rd Edition
1111780684, 9781111780685