

Question
Introduction This problem is based on Netflix Inc. and it is designed to underscore the power of financial ratios and the relationship between numbers and
Introduction
This problem is based on Netflix Inc. and it is designed to underscore the power of financial ratios and the relationship between numbers and strategy. Whether we are making a personal plan for retirement or we are leading an organization, when making decisions that involve financial resources and strategies, ratios are an important because they highlight relationships.
In the introductory paragraphs of their SEC Form 10-K, prepared for the 2018 fiscal year, Netflix describes their company as the worlds leading internet entertainment service with over 139 million paid memberships in over 190 countries enjoying TV series, documentaries and feature films across a wide variety of genres and languages. (Netflix Inc., 2018) Numbers are an essential part of the Netflix story.
Netflix was founded in 1997 on a business model that employed the then new idea of placing videos in mailers and mailing them to subscribers in return for small rents. Subscribers would take the videos out of the mailers, watch them on their players at home, and send them back to Netflix. The company has come a long way since 1997. Netflix is an outstanding example of a company that has continuously reinvented itself in response to challenges emanating from a rapidly changing environment. Still, their future success is in no way guaranteed. The excerpt which follows is taken from the 2018 10-K report Netflix filed with the SEC.
We are a pioneer in the internet delivery of TV shows and movies, launching our streaming service in 2007. Since this launch, we have developed an ecosystem for internet-connected screens and have added increasing amounts of content that enable consumers to enjoy TV shows and movies directly on their internet-connected screens. As a result of these efforts, we have experienced growing consumer acceptance of, and interest in, the delivery of TV shows and movies directly over the internet.
Our core strategy is to grow our streaming membership business globally within the parameters of our profit margin targets. We are continuously improving our members' experience by expanding our streaming content with a focus on a programming mix of content that delights our members. In addition, we are continuously enhancing our user interface and extending our streaming service to more internet-connected screens. Our members can download a selection of titles for offline viewing. (Netflix Inc., 2018)
Netflix has embraced the concept of providing original programming. Their programs and documentaries have been honored with Emmy, Golden Globe, and Academy Oscar awards.
Operating/Profitability Metrics
Over the three-year time period covering fiscal years 2018, 2017, and 2016, the amount Netflix spent on marketing more than doubled. During this same time period revenues also increased dramatically.
1. Expressed as a percentage of sales revenue, by what percent has the amount spent on marketing increased or (decreased) when the ratio for the fiscal year ended 12/31/16 is compared to the ratio for the fiscal year ended 12/31/18? Round to 2 decimal places.
2. Marketing appears to be a crucial part of Netflixs operating strategy and their cost structure. Without a major commitment to marketing it appears that Netflix could not achieve its goal of increasing revenue from subscriptions. If they could, we can assume that Netflix would cut back on marketing and devote those funds to other purposes. Explain how the relationship between revenue and marketing expense creates a cost structure that results in a barrier to entry that would discourage or prevent existing and potential competitors from attempting to compete with Netflix for market share.
3.During the three-year period ended December 31, 2018, has Netflix depended upon leveraging debt as an essential part of their growth strategy? Explain.
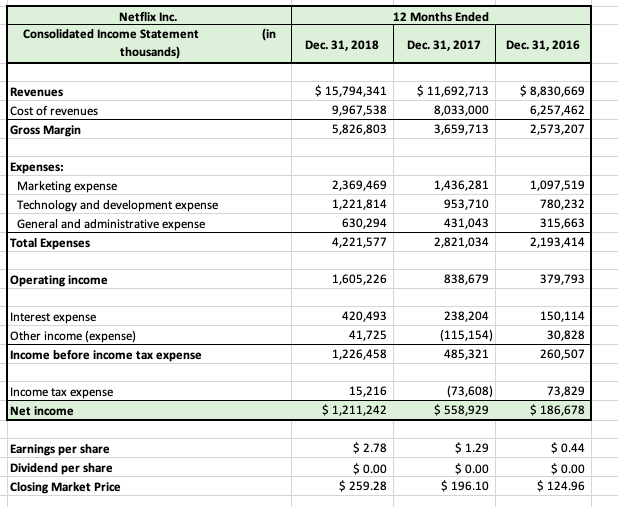
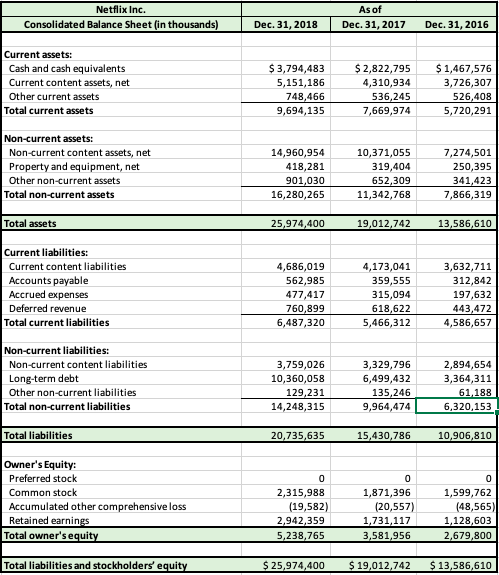
12 Months Ended Netflix Inc. Consolidated Income Statement thousands) (in Dec. 31, 2018 Dec. 31, 2017 Dec. 31, 2016 Revenues Cost of revenues Gross Margin $ 15,794,341 9,967,538 5,826,803 $ 11,692,713 8,033,000 3,659,713 $ 8,830,669 6,257,462 2,573,207 Expenses: Marketing expense Technology and development expense General and administrative expense Total Expenses 2,369,469 1,221,814 630,294 4,221,577 1,436,281 953,710 431,043 2,821,034 1,097,519 780,232 315,663 2,193,414 Operating income 1,605,226 838,679 379,793 Interest expense Other income (expense) Income before income tax expense 420,493 41,725 1,226,458 238,204 (115,154) 485,321 150,114 30,828 260,507 Income tax expense Net income 15,216 $ 1,211,242 (73,608) $ 558,929 73,829 $ 186,678 Earnings per share Dividend per share Closing Market Price $ 2.78 $ 0.00 $ 259.28 $ 1.29 $ 0.00 $ 196.10 $ 0.44 $ 0.00 $ 124.96 Netflix Inc. Consolidated Balance Sheet (in thousands) As of Dec. 31, 2017 Dec. 31, 2018 Dec. 31, 2016 Current assets: Cash and cash equivalents Current content assets, net Other current assets Total current assets $ 3,794,483 5,151,186 748,466 9,694,135 $ 2,822,795 4,310,934 536,245 7,669,974 $ 1,467,576 3,726,307 526,408 5,720,291 Non-current assets: Non-current content assets, net Property and equipment, net Other non-current assets Total non-current assets 14,960,954 418,281 901,030 16,280,265 10,371,055 319,404 652,309 11,342,768 7,274,501 250,395 341,423 7,866,319 Total assets 25,974,400 19,012,742 13,586,610 4,686,019 562,985 477,417 760,899 6,487,320 4,173,041 359,555 315,094 618,622 5,466,312 3,632,711 312,842 197,632 443,472 4,586,657 Current liabilities: Current content liabilities Accounts payable Accrued expenses Deferred revenue Total current liabilities Non-current liabilities: Non-current content liabilities Long-term debt Other non-current liabilities Total non-current liabilities 3,759,026 10,360,058 129,231 14,248,315 3,329,796 6,499,432 135,246 9,964,474 2,894,654 3,364,311 61,188 6,320,153 Total liabilities 20,735,635 15,430,786 10,906,810 Owner's Equity Preferred stock Common stock Accumulated other comprehensive loss Retained earnings Total owner's equity 0 2,315,988 (19,582) 2,942,359 5,238,765 0 1,871,396 (20,557) 1,731,117 3,581,956 0 1,599,762 (48,565) 1,128,603 2,679,800 Total liabilities and stockholders' equity $ 25,974,400 $ 19,012,742 $ 13,586,610
Step by Step Solution
There are 3 Steps involved in it
Step: 1

Get Instant Access to Expert-Tailored Solutions
See step-by-step solutions with expert insights and AI powered tools for academic success
Step: 2

Step: 3
Ace Your Homework with AI
Get the answers you need in no time with our AI-driven, step-by-step assistance
Get Started
Auditing Business Continuity Plans Assess And Improve Your Performance Against ISO 22301
Authors: John Silltow
2nd Edition
058074342X, 978-0580743429