

Question
Inventory Specialists, Inc. provides inventory verification services for the grocery store industry. Each week they physically count the inventory of each of the products their
Inventory Specialists, Inc. provides inventory verification services for the grocery store industry. Each week they physically count the inventory of each of the products their customers carry and check the numbers against what the customers automated inventory tracking system indicates is being held in inventory. Table 5 below provides the number of products for which their was a discrepancy between the physical count and the amount provided by the inventory tracking system of Customer X over the last year. The company would like to determine whether Customer Xs automated inventory tracking process is in control or experiencing an excessive level of non-random variation as it pertains to the count discrepancies. Use the data provided in Table 5 to answer the following questions. Carry calculations out to at least 3 decimal places.
-
What is type of control chart(s) should be constructed based on the data provided (i.e., c, p, X-bar, and/or R)? (2)
-
Whatisthecentrallimitforthisdata?(2)
-
What are the 3-sigma upper and lower control limits? Show your calculations. (2)
-
Construct the control chart showing not only the control limits but also the zone lines for the Pattern
Test discussed in class. Label the zones on the chart and identify the value of the top and bottom borders of each zone by completing the Zone Information Table below (Table 6). Note: The control chart may be created in Excel but a copy of it should be embedded as a picture in your test document. Make sure it is large enough to read all elements. (6)
-
State whether the process appears to be in control. Justify your answer. (3)
-
List all of the patterns associated with the Pattern Test discussed in class and identify if any Pattern Test
violations found. If any Pattern Test violations are found, identify which points fit the pattern. (5)
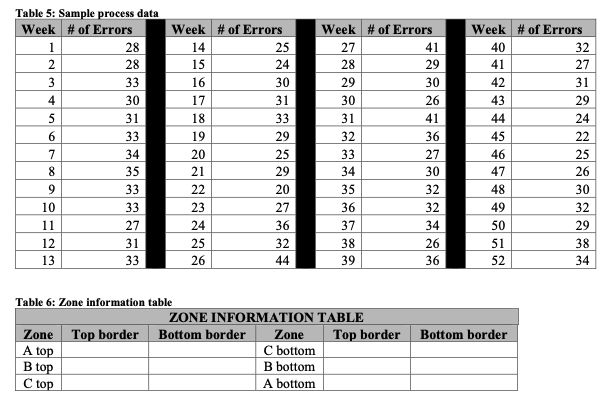
29 Table 5: Sample process data Week # of Errors 1 28 2 28 3 33 4 30 5 31 6 33 7 34 8 35 9 33 10 33 11 27 12 31 13 33 36 Week # of Errors 14 25 15 24 16 30 17 31 18 33 19 29 20 25 21 29 22 20 23 27 24 36 25 32 26 44 Week # of Errors 27 41 28 29 29 30 30 26 31 41 32 33 27 34 30 35 32 36 32 37 34 38 26 39 36 Week # of Errors 40 32 41 27 42 31 43 44 24 45 22 46 25 47 26 48 30 49 32 50 29 51 38 52 34 Table 6: Zone information table ZONE INFORMATION TABLE Zone Top border Bottom border Zone Top border C bottom B bottom A bottom Bottom border A top B top C top
Step by Step Solution
There are 3 Steps involved in it
Step: 1

Get Instant Access to Expert-Tailored Solutions
See step-by-step solutions with expert insights and AI powered tools for academic success
Step: 2

Step: 3
Ace Your Homework with AI
Get the answers you need in no time with our AI-driven, step-by-step assistance
Get Started
Managerial Accounting Special Edition For California State University Los Angeles
Authors: Garrison
14th Edition
0077519973, 978-0077519971