Answered step by step
Verified Expert Solution
Question
1 Approved Answer
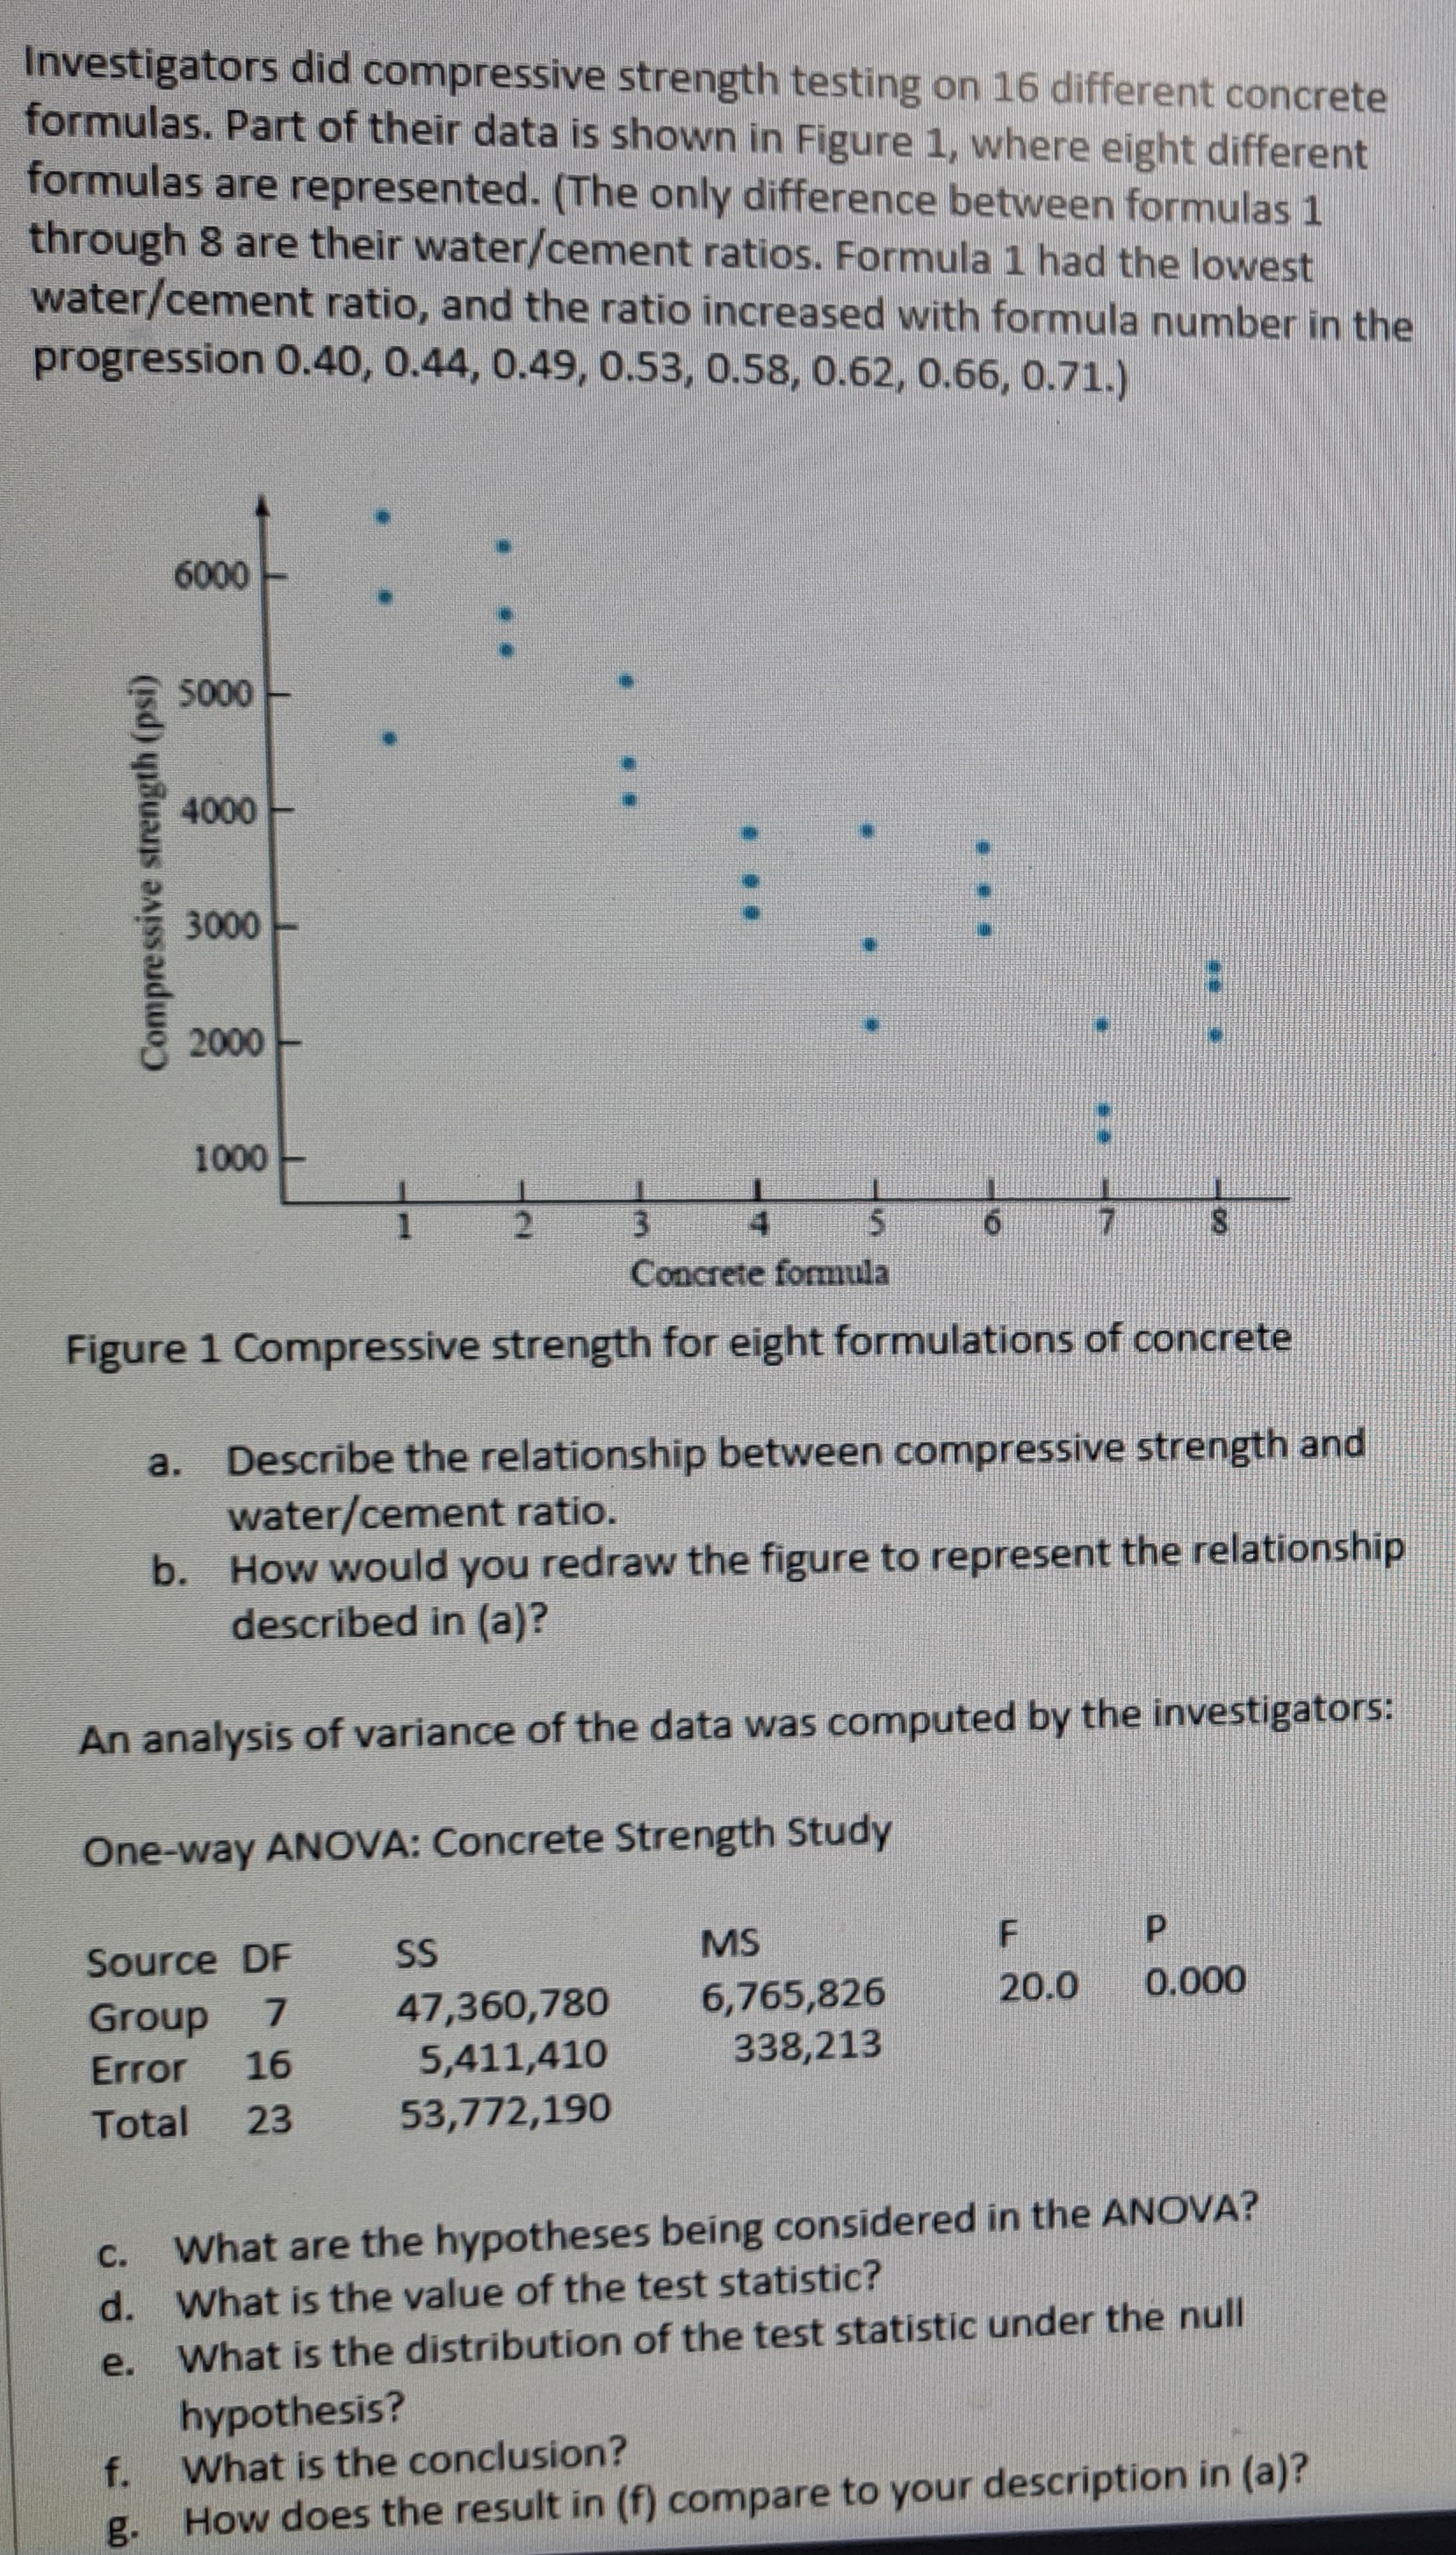
Investigators did compressive strength testing on 16 different concrete formulas. Part of their data is shown in Figure 1, where eight different formulas are

Investigators did compressive strength testing on 16 different concrete formulas. Part of their data is shown in Figure 1, where eight different formulas are represented. (The only difference between formulas 1 through 8 are their water/cement ratios. Formula 1 had the lowest water/cement ratio, and the ratio increased with formula number in the progression 0.40, 0.44, 0.49, 0.53, 0.58, 0.62, 0.66, 0.71.) Compressive strength (psi) 6000 5000 4000- 3000- 2000 1000 2 3 S 7 Concrete formula Figure 1 Compressive strength for eight formulations of concrete a. Describe the relationship between compressive strength and water/cement ratio. b. How would you redraw the figure to represent the relationship described in (a)? An analysis of variance of the data was computed by the investigators: One-way ANOVA: Concrete Strength Study Source DF SS MS F P Group 7 47,360,780 6,765,826 20.0 0.000 Error 16 5,411,410 338,213 Total 23 53,772,190 e. C. What are the hypotheses being considered in the ANOVA? d. What is the value of the test statistic? What is the distribution of the test statistic under the null hypothesis? f. What is the conclusion? g- How does the result in (f) compare to your description in (a)?
Step by Step Solution
There are 3 Steps involved in it
Step: 1

Get Instant Access to Expert-Tailored Solutions
See step-by-step solutions with expert insights and AI powered tools for academic success
Step: 2

Step: 3

Ace Your Homework with AI
Get the answers you need in no time with our AI-driven, step-by-step assistance
Get Started


