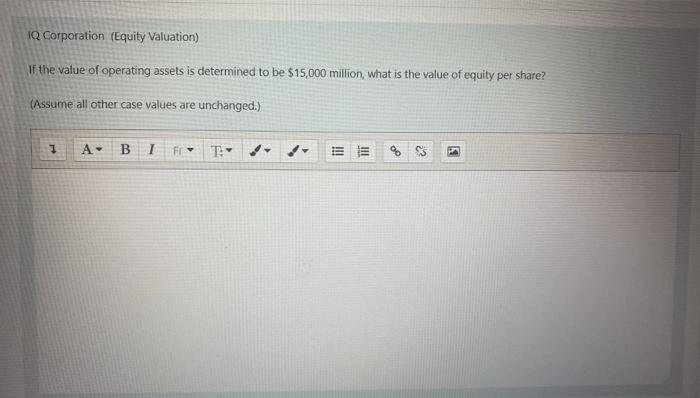
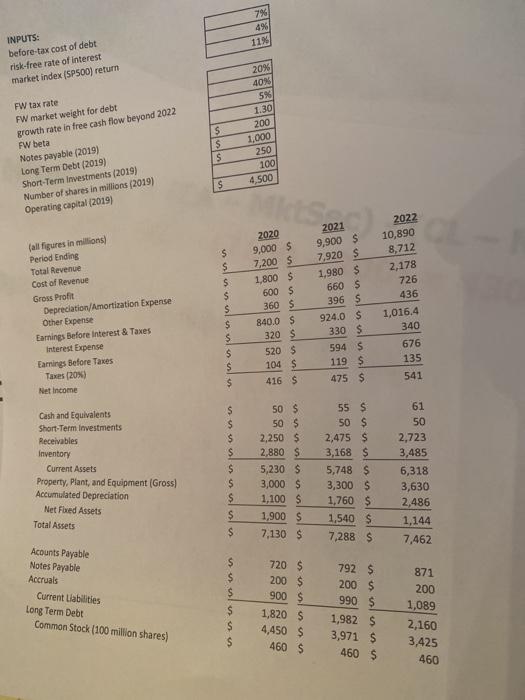
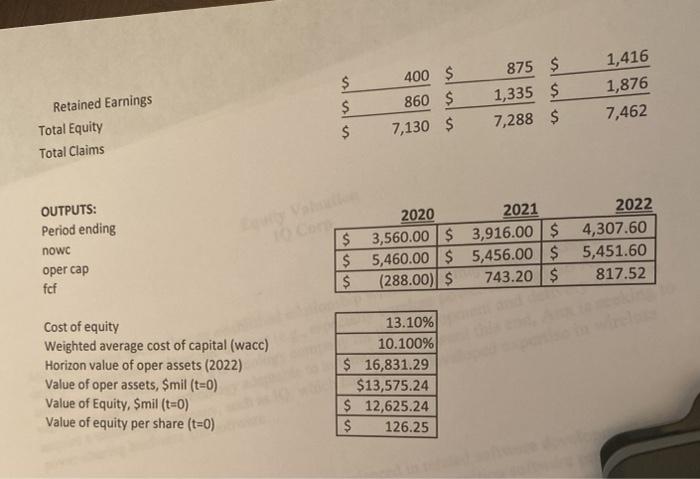
IQ Corporation (Equity Valuation) If the value of operating assets is determined to be $15,000 million, what is the value of equity per share? (Assume all other case values are unchanged.) 1 A- BIF !!! III 7% 6% 11% INPUTS: before-tax cost of debt risk-free rate of interest market index (SP500) return FW tax rate FW market weight for debt growth rate in free cash flow beyond 2022 FW beta Notes payable (2019) Long Term Debt (2019) Short-Term Investments (2019) Number of shares in millions (2019) Operating capital (2019) s s $ 20% 40N 5% 1.30 200 1,000 250 100 4,500 $ fall figures in millions Period Ending Total Revenue Cost of Revenue Gross Profit Depreciation/Amortization Expense Other Expense Earnings Before Interest & Taxes Interest Expense Earnings Before Taxes $ $ $ $ $ $ 2020 9,000 $ 7,200 $ 1,800 $ 600 S 360 $ 840,0 $ 320 $ 520 $ 2021 9,900 $ 7,920 S 1,980 $ 660 $ 396 S 924.0 $ 2022 10,890 8,712 2,178 726 436 1,016.4 340 676 135 541 $ $ $ 330 $ 594 5 119S 475 S Taxes (20%) Net Income 104 $ 416 $ s $ $ $ Cash and Equivalents Short-Term Investments Receivables Inventory Current Assets Property, Plant, and Equipment (Gross Accumulated Depreciation Net Fred Assets Total Assets $ $ $ $ $ 50 $ 50 $ 2,250 $ 2,880 $ 5,230 $ 3,000 $ 1,100 $ 1,900 $ 7,130 $ 55$ 50 $ 2,475 $ 3,168 $ 5,748 $ 3,300 $ 1,760 $ 1,540 $ 7,288 $ 61 50 2,723 3,485 6,318 3,630 2,486 1,144 7,462 $ Acounts Payable Notes Payable Accruals Current Liabilities Long Term Debt Common Stock (100 million shares) 720 $ 200 $ 900 $ 1,820 $ 4,450 $ 460 $ 792 $ 200 $ 990 $ 1,982 $ 3,971 $ 460 $ 871 200 1,089 2,160 3,425 460 $ 875 $ 1,335 $ 7,288 $ 1,416 1,876 7,462 400 $ 860 $ 7,130 $ $ Retained Earnings Total Equity Total Claims $ OUTPUTS: Period ending nowc oper cap fcf 2020 2021 $ 3,560.00 $ 3,916.00 $ $ 5,460.00 $ 5,456.00 $ $ (288.00) $ 743.20 $ 2022 4,307.60 5,451.60 817.52 Cost of equity Weighted average cost of capital (wacc) Horizon value of oper assets (2022) Value of oper assets, Smil (t=0) Value of Equity, Smil (t=0) Value of equity per share (t=0) 13.10% 10.100% $ 16,831.29 $13,575.24 $ 12,625.24 $ 126.25 IQ Corporation (Equity Valuation) If the value of operating assets is determined to be $15,000 million, what is the value of equity per share? (Assume all other case values are unchanged.) 1 A- BIF !!! III 7% 6% 11% INPUTS: before-tax cost of debt risk-free rate of interest market index (SP500) return FW tax rate FW market weight for debt growth rate in free cash flow beyond 2022 FW beta Notes payable (2019) Long Term Debt (2019) Short-Term Investments (2019) Number of shares in millions (2019) Operating capital (2019) s s $ 20% 40N 5% 1.30 200 1,000 250 100 4,500 $ fall figures in millions Period Ending Total Revenue Cost of Revenue Gross Profit Depreciation/Amortization Expense Other Expense Earnings Before Interest & Taxes Interest Expense Earnings Before Taxes $ $ $ $ $ $ 2020 9,000 $ 7,200 $ 1,800 $ 600 S 360 $ 840,0 $ 320 $ 520 $ 2021 9,900 $ 7,920 S 1,980 $ 660 $ 396 S 924.0 $ 2022 10,890 8,712 2,178 726 436 1,016.4 340 676 135 541 $ $ $ 330 $ 594 5 119S 475 S Taxes (20%) Net Income 104 $ 416 $ s $ $ $ Cash and Equivalents Short-Term Investments Receivables Inventory Current Assets Property, Plant, and Equipment (Gross Accumulated Depreciation Net Fred Assets Total Assets $ $ $ $ $ 50 $ 50 $ 2,250 $ 2,880 $ 5,230 $ 3,000 $ 1,100 $ 1,900 $ 7,130 $ 55$ 50 $ 2,475 $ 3,168 $ 5,748 $ 3,300 $ 1,760 $ 1,540 $ 7,288 $ 61 50 2,723 3,485 6,318 3,630 2,486 1,144 7,462 $ Acounts Payable Notes Payable Accruals Current Liabilities Long Term Debt Common Stock (100 million shares) 720 $ 200 $ 900 $ 1,820 $ 4,450 $ 460 $ 792 $ 200 $ 990 $ 1,982 $ 3,971 $ 460 $ 871 200 1,089 2,160 3,425 460 $ 875 $ 1,335 $ 7,288 $ 1,416 1,876 7,462 400 $ 860 $ 7,130 $ $ Retained Earnings Total Equity Total Claims $ OUTPUTS: Period ending nowc oper cap fcf 2020 2021 $ 3,560.00 $ 3,916.00 $ $ 5,460.00 $ 5,456.00 $ $ (288.00) $ 743.20 $ 2022 4,307.60 5,451.60 817.52 Cost of equity Weighted average cost of capital (wacc) Horizon value of oper assets (2022) Value of oper assets, Smil (t=0) Value of Equity, Smil (t=0) Value of equity per share (t=0) 13.10% 10.100% $ 16,831.29 $13,575.24 $ 12,625.24 $ 126.25


