Answered step by step
Verified Expert Solution
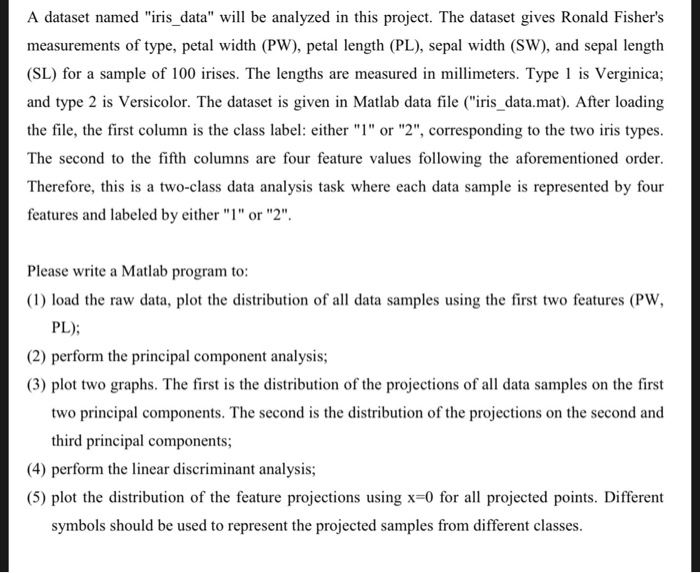
Link Copied!

Question

1 Approved Answer

iris_data.mat contains 5 columns the first column being the main one or the x axis, and the other ones being the secondary columns. Each column

image text in transcribed
iris_data.mat
contains 5 columns
the first column being the main one or the x axis, and the other ones being the secondary columns. Each column has 100 samples. The file itself is 100x5.
I could not attach the file here, but please if you could show the work that i would have to do to complete the tasks.
A dataset named "iris_data" will be analyzed in this project. The dataset gives Ronald Fisher's measurements of type, petal width (PW), petal length (PL), sepal width (SW), and sepal length (SL) for a sample of 100 irises. The lengths are measured in millimeters. Type 1 is Verginica; and type 2 is Versicolor. The dataset is given in Matlab aa file'rsdatamat)Afer loding the file, the first column is the class label: either "I" or "2", corresponding to the two iris types. The second to the fifth columns are four feature values following the aforementioned order. Therefore, this is a two-class data analysis task where each data sample is represented by four features and labeled by either"" or"2" Please write a Matlab program to: (1) load the raw data, plot the distribution of all data samples using the first two features (PW, PL) (2) perform the principal component analysis (3) plot two graphs. The first is the distribution of the projections of all data samples on the first two principal components. The second is the distribution of the projections on the second and third principal components; (4) perform the linear discriminant analysis; (5) plot the distribution of the feature projections using x-0 for all projected points. Different symbols should be used to represent the projected samples from different classes

Step by Step Solution

There are 3 Steps involved in it

Step: 1

blur-text-image

Get Instant Access to Expert-Tailored Solutions

See step-by-step solutions with expert insights and AI powered tools for academic success

Step: 2

blur-text-image

Step: 3

blur-text-image

Ace Your Homework with AI

Get the answers you need in no time with our AI-driven, step-by-step assistance

Get Started

Recommended Textbook for

Intelligent Information And Database Systems Third International Conference Achids 2011 Daegu Korea April 2011 Proceedings Part 2 Lnai 6592

Authors: Ngoc Thanh Nguyen ,Chong-Gun Kim ,Adam Janiak

2011th Edition

3642200419, 978-3642200410

More Books

Students also viewed these Databases questions

Question

What is the use of numpy library? Use the editor to format your

Answered: 1 week ago