

Question
is assignment assesses your skills/knowledge on identifying polynomial and rational functions, the domain, using the graphical representation of these functions, and hence you will study
is assignment assesses your skills/knowledge on identifying polynomial and rational functions, the domain, using the graphical representation of these functions, and hence you will study the behavior- discontinuities, increasing, decreasing and extrema.
In real life situations the growth need not be smooth and always increasing or decreasing. The functional values may be having different turnings and may be disappearing at some points. These kinds of situations are represented by polynomial and rational functions. This assignment will enable you to identify such functions and interpret them mathematically and graphically.
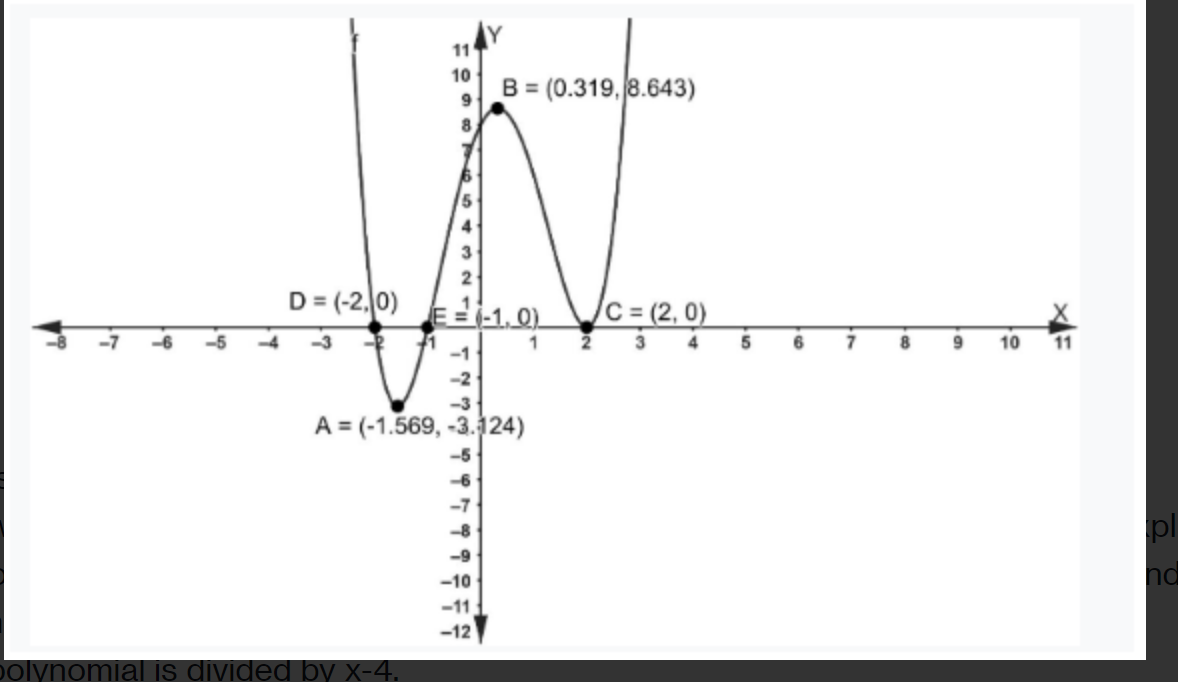
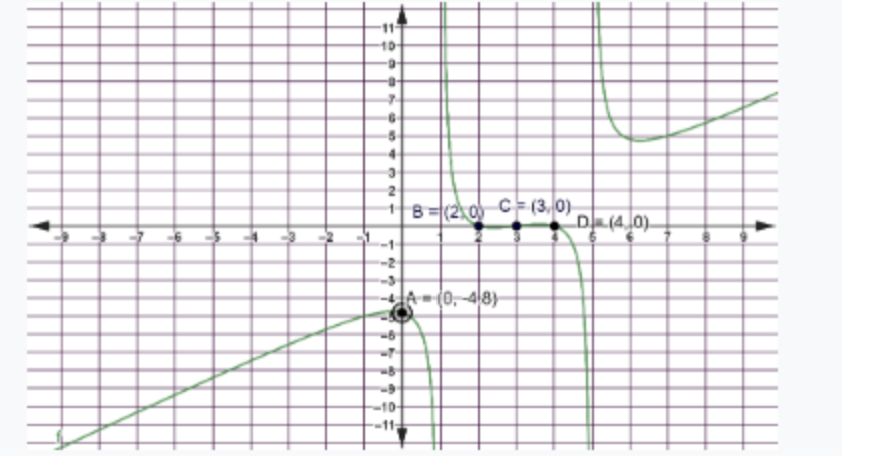
You are required to complete all the 5 tasks in this assignment,answer the following questions, and show stepwise calculations. When you are instructed to make a graph in this assignment, please use GeoGebra graphing tool. Task 1. Interpret the following graph in detail:
Step by Step Solution
There are 3 Steps involved in it
Step: 1

Get Instant Access to Expert-Tailored Solutions
See step-by-step solutions with expert insights and AI powered tools for academic success
Step: 2

Step: 3
Ace Your Homework with AI
Get the answers you need in no time with our AI-driven, step-by-step assistance
Get Started
College Algebra
Authors: Margaret L. Lial, John Hornsby, David I. Schneider, Callie Daniels
12th edition
134697022, 9780134313795 , 978-0134697024