Answered step by step
Verified Expert Solution
Question
1 Approved Answer
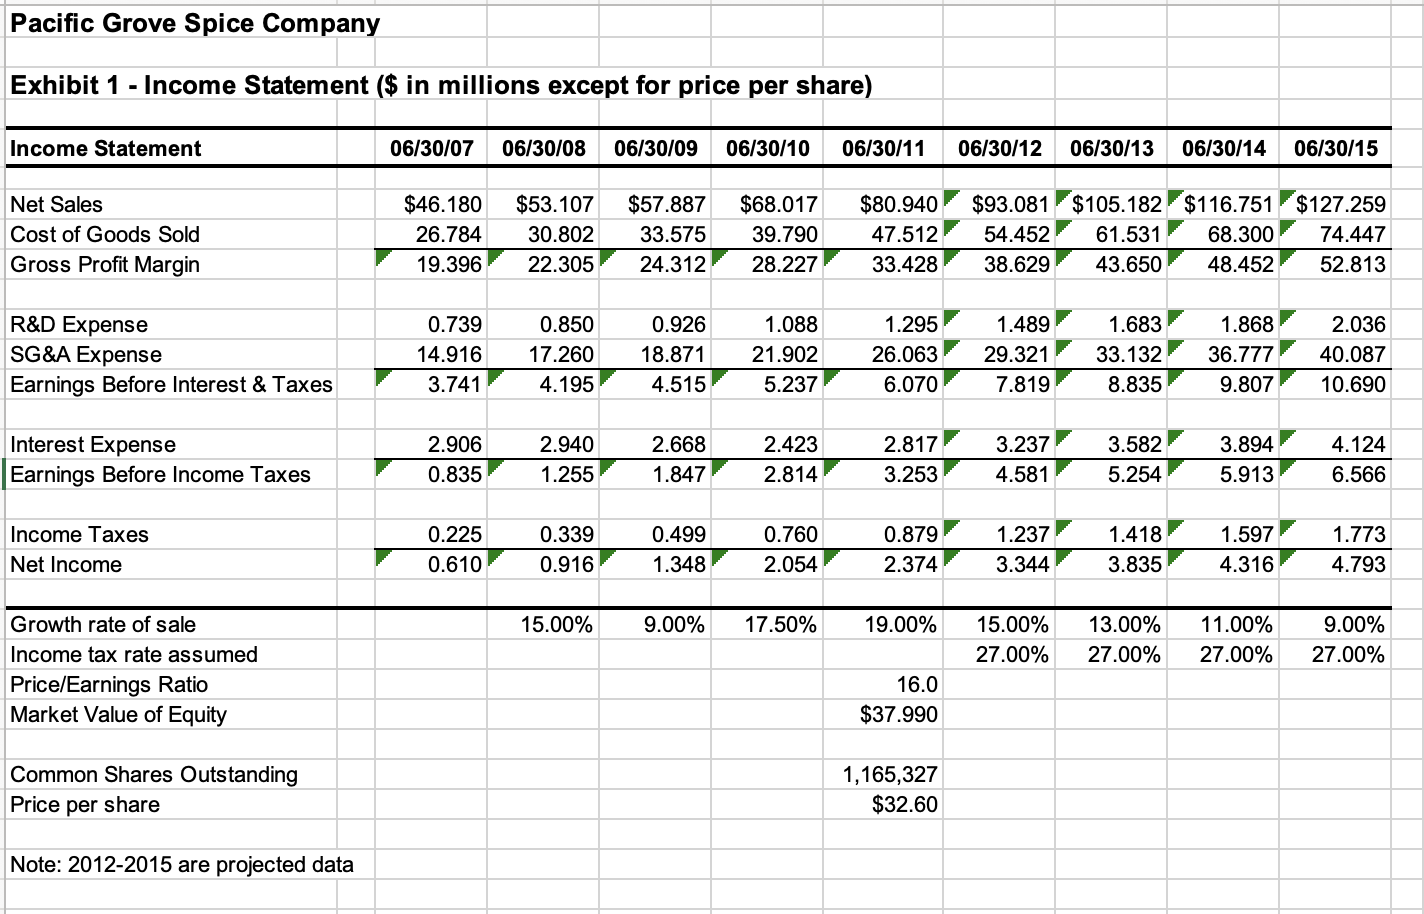
Is it a positive NPV decision for Pacific? Pacific Grove Spice Company Exhibit 1 - Income Statement ($ in millions except for price per share)


Is it a positive NPV decision for Pacific?
Pacific Grove Spice Company Exhibit 1 - Income Statement ($ in millions except for price per share) Income Statement Net Sales Cost of Goods Sold Gross Profit Margin R&D Expense SG&A Expense Earnings Before Interest & Taxes Interest Expense Earnings Before Income Taxes Income Taxes Net Income Growth rate of sale Income tax rate assumed Price/Earnings Ratio Market Value of Equity Common Shares Outstanding Price per share Note: 2012-2015 are projected data 06/30/07 06/30/08 06/30/09 06/30/10 06/30/11 06/30/12 06/30/13 06/30/14 06/30/15 $46.180 $53.107 $57.887 26.784 30.802 33.575 19.396 22.305 24.312 0.739 0.850 14.916 17.260 3.741 4.195 2.906 0.835 0.225 0.610 2.940 1.255 0.339 0.916 15.00% 0.926 1.088 18.871 21.902 4.515 5.237 2.668 1.847 $68.017 $80.940 $93.081 $105.182 $116.751 $127.259 39.790 47.512 54.452 61.531 68.300 74.447 28.227 33.428 38.629 43.650 48.452 52.813 0.499 1.348 2.423 2.814 0.760 2.054 9.00% 17.50% 1.295 1.489 1.683 26.063 29.321 33.132 6.070 7.819 8.835 2.817 3.253 0.879 2.374 19.00% 16.0 $37.990 1,165,327 $32.60 3.237 4.581 1.237 3.344 3.582 5.254 1.418 3.835 1.868 36.777 9.807 3.894 5.913 1.597 4.316 15.00% 13.00% 11.00% 27.00% 27.00% 27.00% 2.036 40.087 10.690 4.124 6.566 1.773 4.793 9.00% 27.00%
Step by Step Solution
There are 3 Steps involved in it
Step: 1
To calculate the projected market value of equity for Pacific Grove Spice Company we need to first estimate the net income for the projected years 201...
Get Instant Access to Expert-Tailored Solutions
See step-by-step solutions with expert insights and AI powered tools for academic success
Step: 2

Step: 3

Ace Your Homework with AI
Get the answers you need in no time with our AI-driven, step-by-step assistance
Get Started


