

Answered step by step
Verified Expert Solution
Question
1 Approved Answer
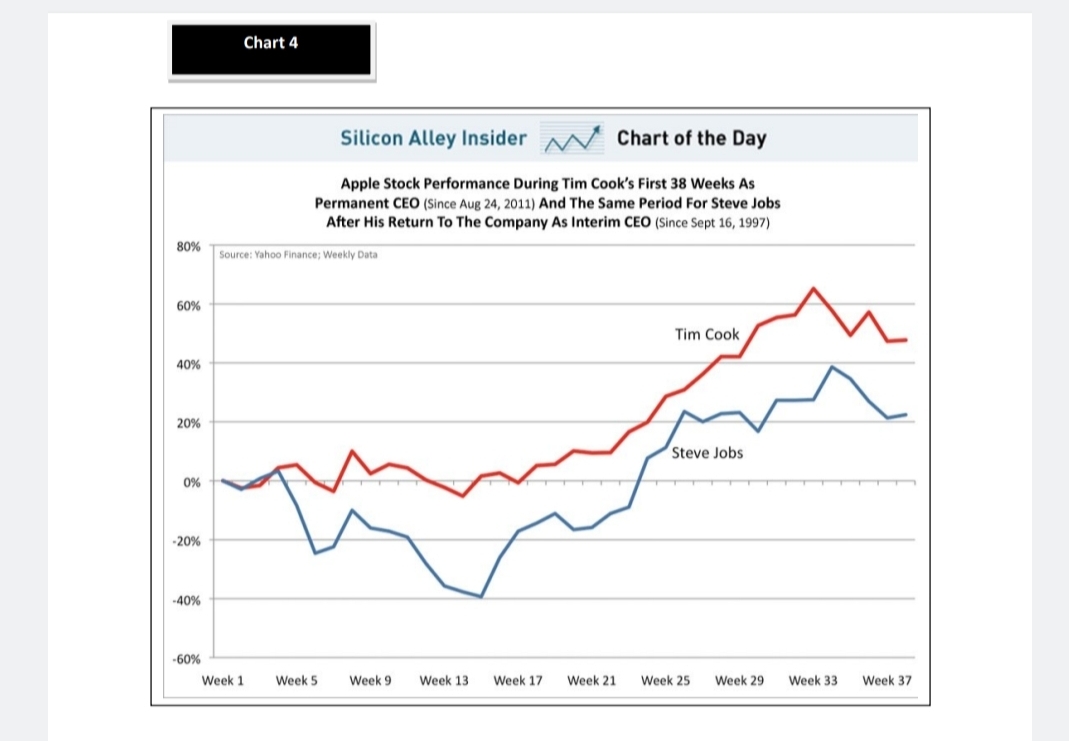
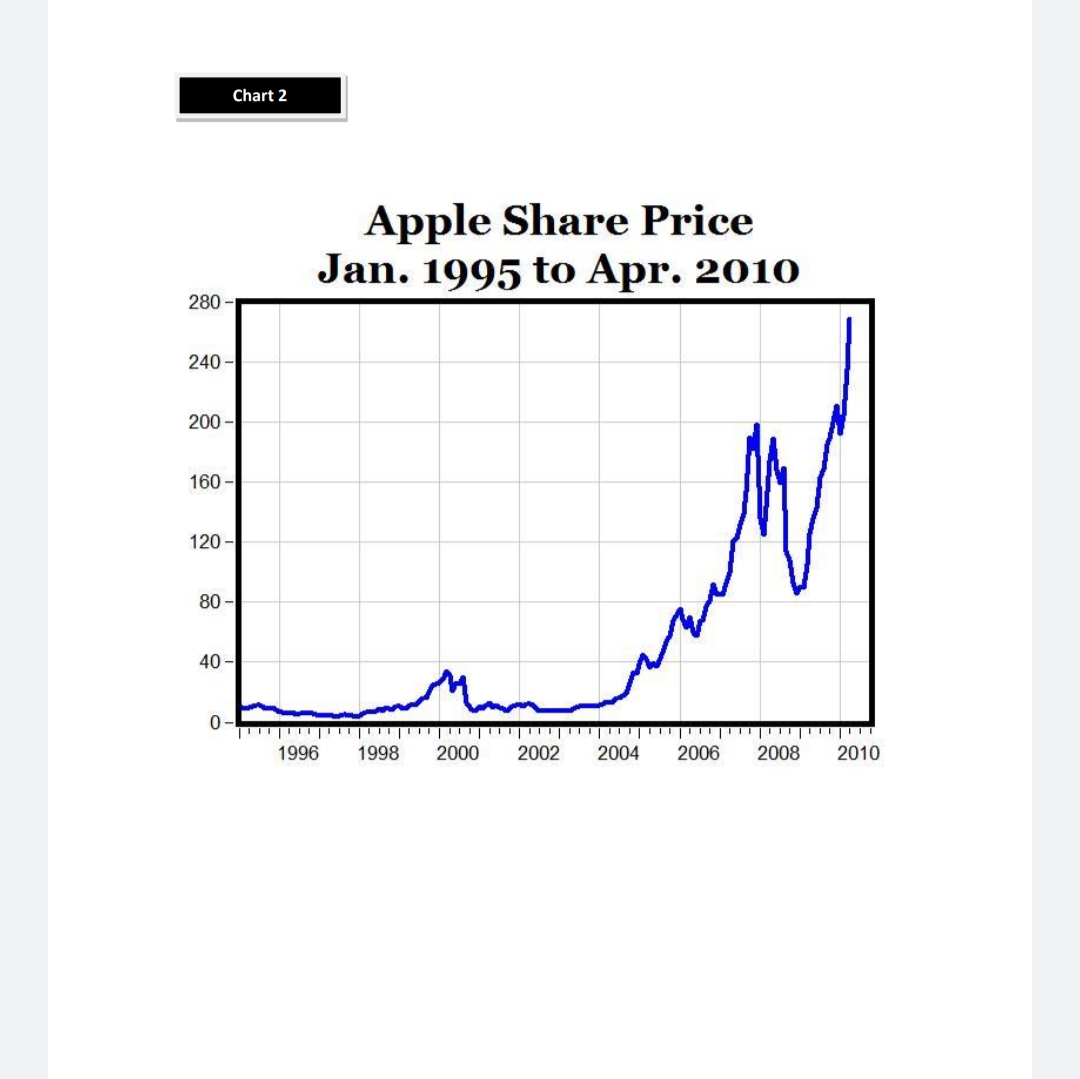
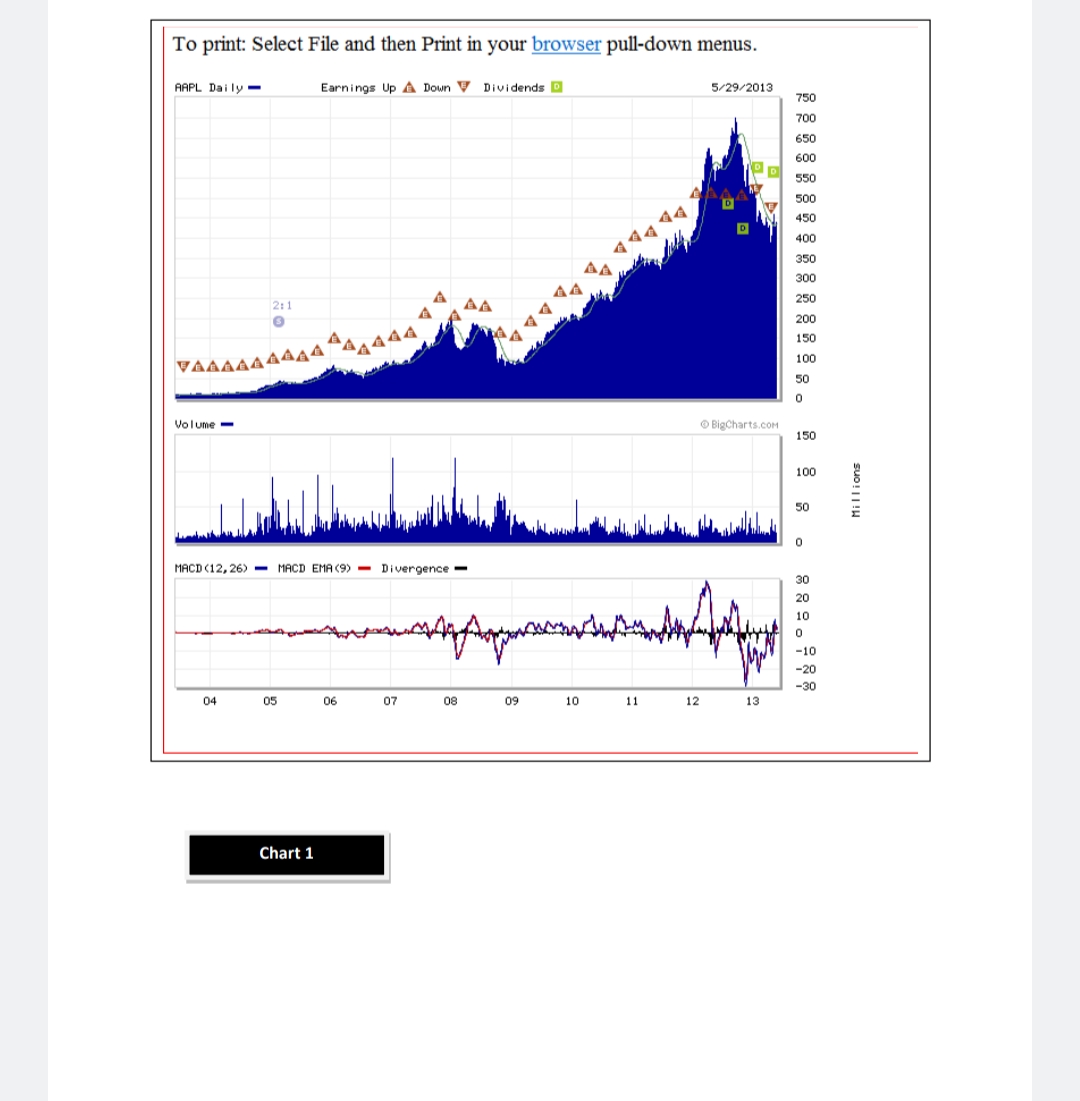
Is the chart Fundamental or technical analysis Chart 2 Apple Share Price Jan. 1995 to Apr. 2010 Chart 4 Silicon Alley Insider Chart of the
Is the chart Fundamental or technical analysis 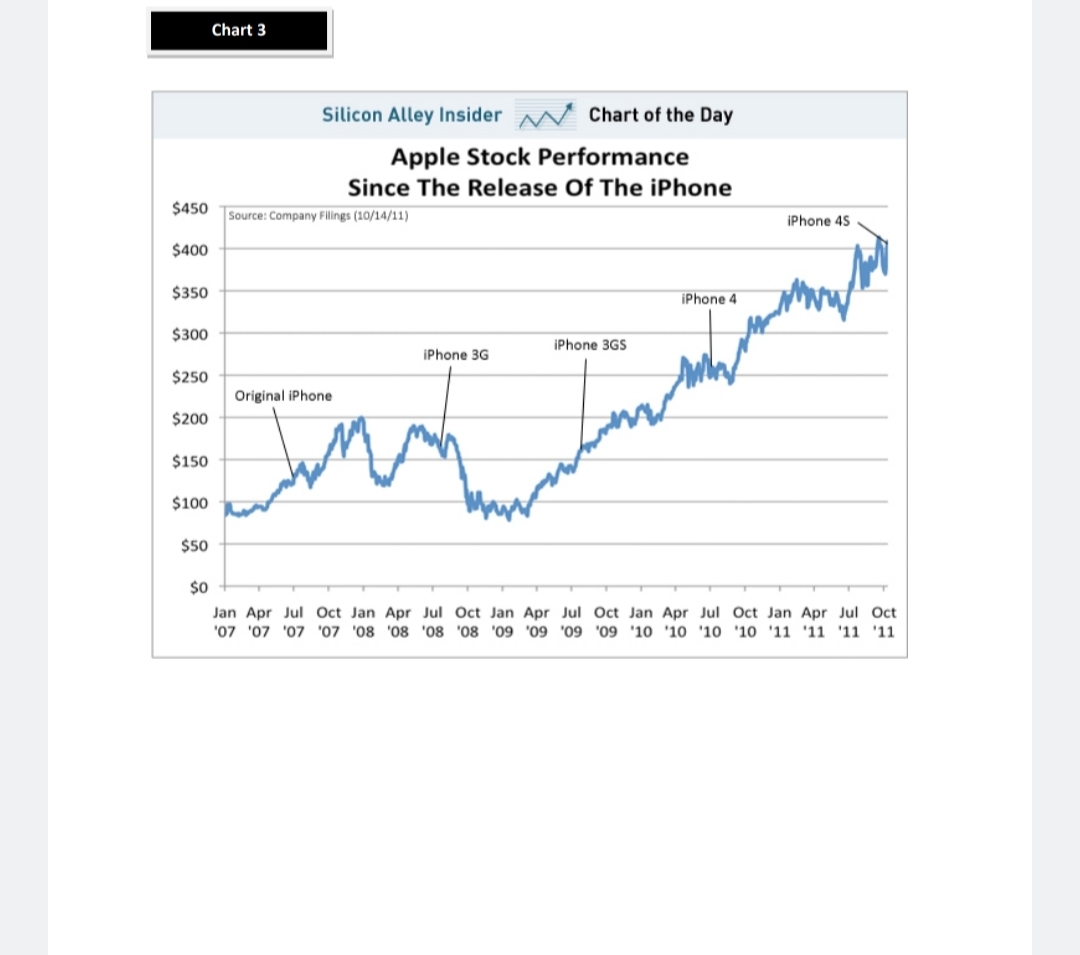
Step by Step Solution
There are 3 Steps involved in it
Step: 1

Get Instant Access to Expert-Tailored Solutions
See step-by-step solutions with expert insights and AI powered tools for academic success
Step: 2

Step: 3
Ace Your Homework with AI
Get the answers you need in no time with our AI-driven, step-by-step assistance
Get Started
Your Money The Missing Manual
Authors: J.D. Roth
1st Edition
0596809409, 978-0596809409