Is this correct 1,000,000 omitted?
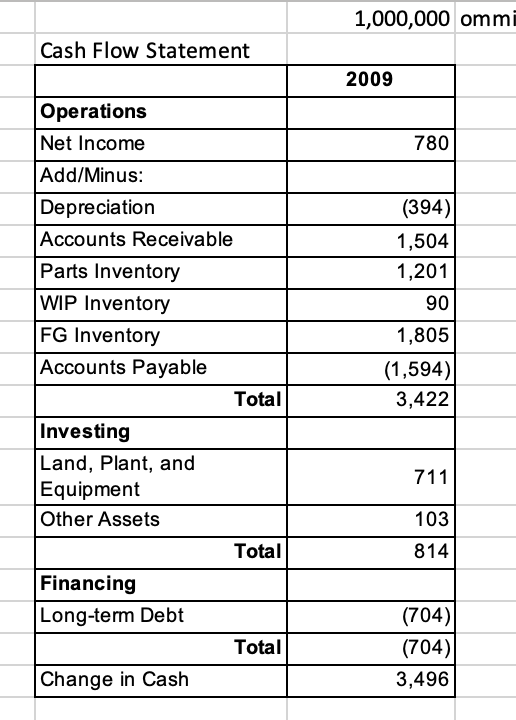
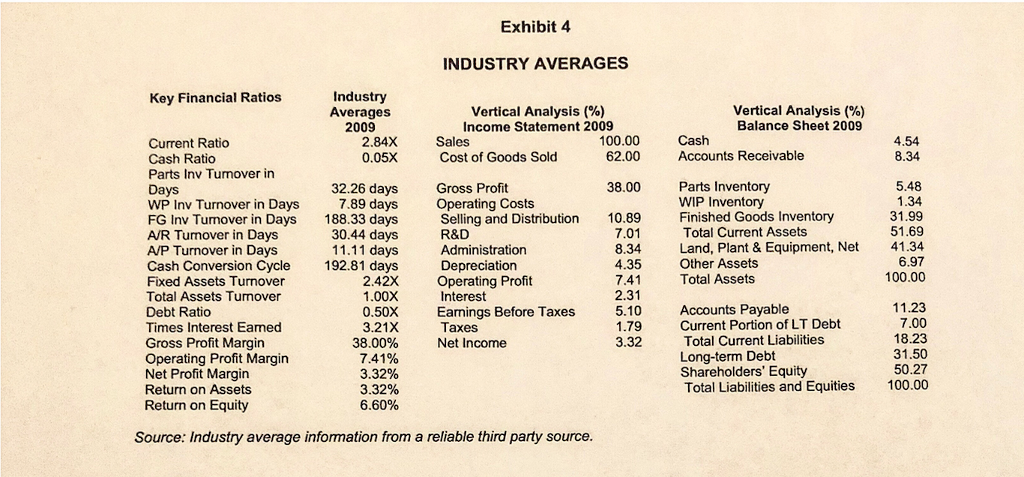
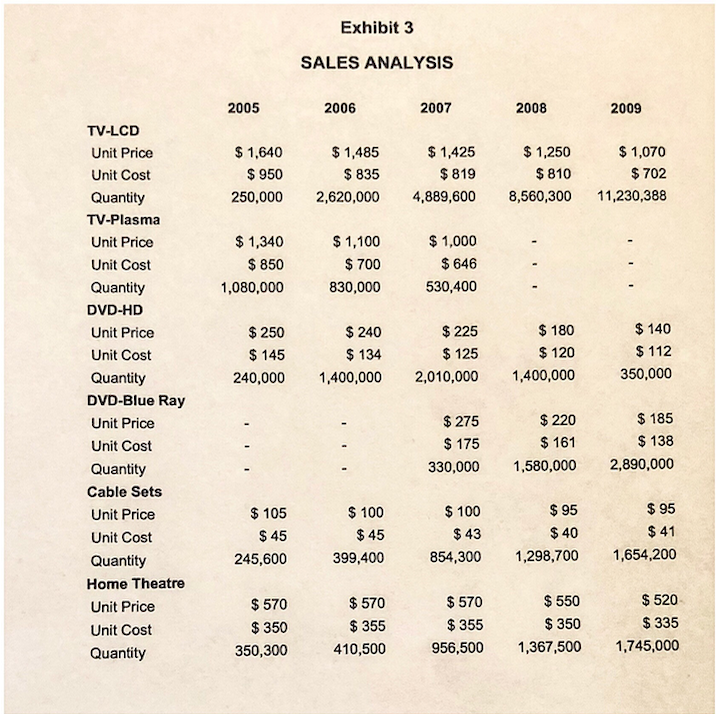
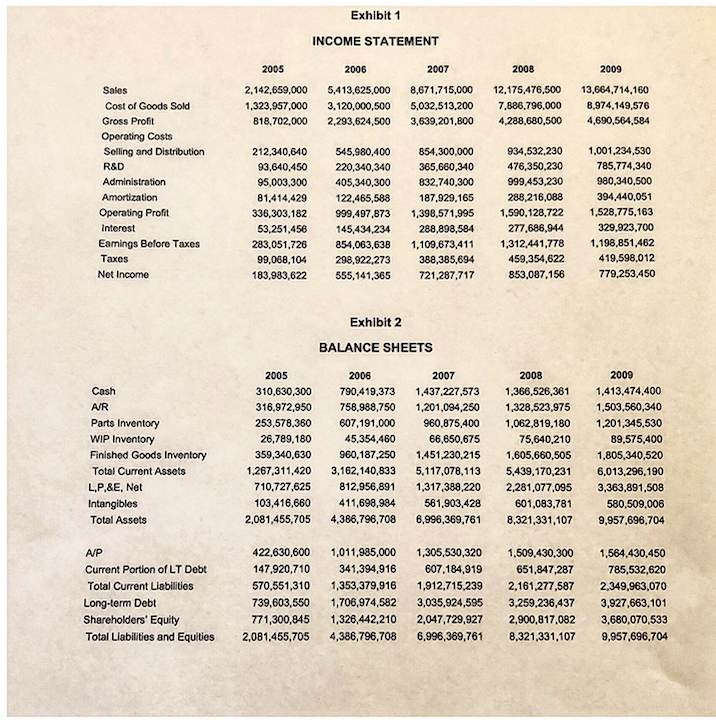
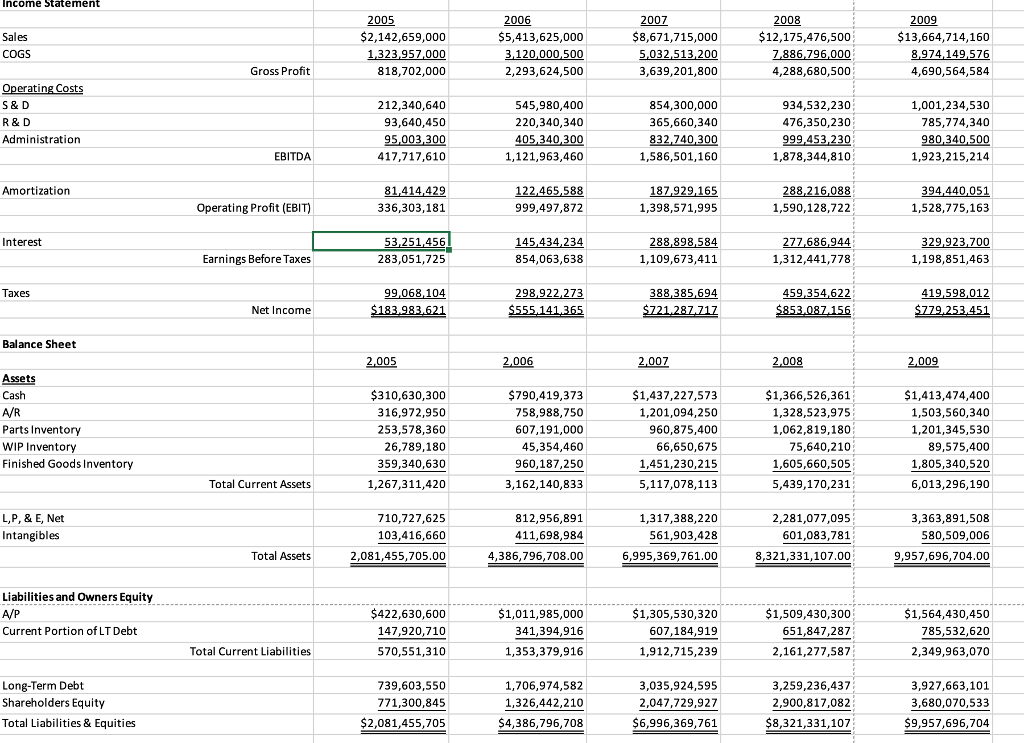
1,000,000 omm Cash Flow Statement 2009 Operations Net Income Add/Minus: Depreciation Accounts Receivable Parts Inventory WIP Inventory FG Inventory Accounts Payable 780 (394) 1,504 1,201 90 1,805 (1,594) 3,422 Total Investing Land, Plant, and Equipment Other Assets 103 814 Total Financing Long-term Debt (704) (704) 3,496 Total Change in Cash Exhibit 4 INDUSTRY AVERAGES Key Financial Ratios Industry Averages 2009 3 Vertical Analysis (%) Income Statement 2009 Vertical Analysis (%) Balance Sheet 2009 100.00 Current Ratio Cash Ratio Parts Inv Tunover in 0.05X Cost of Goods Sold Accounts Receivable Parts Inventory WIP Inventory Finished Goods Inventory Total Current Assets Land, Plant & Equipment, Net Other Assets Total Assets 32.26 days WP Inv Turnover in Days 7.89 days FG Inv Tumover in Days 188.33 days A/R Tumover in Days A/P Turnover in Days Cash Conversion Cycle 192.8 Fixed Assets Turnover Total Assets Turnover Debt Ratio Times Interest Eamed Gross Profit Margin Operating Profit Margin Net Profit Margin Return on Assets Return on Equity Gross Profit Operating Costs Selling and Distribution R&D Administration Depreciation Operating Profit Interest Earnings Before Taxes 10.89 30.44 days 11.11 days 1 days 41.34 100.00 11.23 Accounts Payable Current Portion of LT Debt Total Current Liabilities Long-term Debt Shareholders' Equity Total Liabilities and Equities 3.21X 38.00% 9 3 3.32% 3.32% 100.00 Source: Industry average information from a reliable third party source Exhibit 3 SALES ANALYSIS 2005 2006 2007 2008 2009 TV-LCD Unit Price Unit Cost Quantity TV-Plasma Unit Price Unit Cost Quantity DVD-HD Unit Price Unit Cost Quantity DVD-Blue Ray Unit Price Unit Cost Quantity Cable Sets Unit Price Unit Cost Quantity Home Theatre Unit Price Unit Cost Quantity $1,425 $ 819 250,000 2,620,000 4,889,600 8,560,300 11,230,388 1,640 $950 $1,485 $ 835 $1,250 $810 $1,070 $702 $1,340 $ 850 1,080,000 $1,100 $700 830,000 $1,000 $646 530,400 $180 120 240,000 1,400,000 2,010,000 1,400,000 $250 145 $ 225 $125 $140 $112 350,000 134 $185 $138 330,000 580,000 2,890,000 $275 $ 175 $ 220 $161 $105 $ 45 245,600 100 $45 399,400 $ 95 $ 41 854,300 1,298,700 1,654,200 $ 100 $43 $ 95 $40 $570 $350 350,300 $570 $355 410,500 $ 570 $ 355 $550 $ 350 $ 520 $ 335 956,500 1,367,500 1,745,000 Incomne Statement 2005 2006 2009 $2,142,659,000 818,702,000 212,340,640 S5,413,625,000 2,293,624,500 545,980,400 $8,671,715,000 3,639,201,800 854,300,000 $12,175,476,500 4,288,680,500 934,532,230 $13,664,714,160 4,690,564,584 1,001,234,530 COGS Gross Profit Operating Costs 220,340,340 365,660,340 476,350,230 785,774,340 Administration 417,717,610 1,121,963,460 1,586,501,160 1,878,344,810 1,923,215,214 Amortization Operating Profit (EBIT 336,303,181 999,497,872 1,398,571,995 1,590,128,722 1,528,775,163 Inter Earnings Before Taxes 283,051,725 854,063,638 1,312,441,778 1,198,851,463 Taxes Net Income Balance Sheet 2,006 007 2,008 2,009 Assets Cash A/R Parts Inventory WIP Inventory Finished Goods Inventory 310,630,300 316,972,950 253,578,360 26,789,180 359,340,630 1,267,311,420 $790,419,373 758,988,750 607,191,000 45,354,460 960,187,250 3,162,140,833 $1,437,227,573 1,201,094,250 960,875,400 66,650,675 1,451,230,215 5,117,078,113 $1,366,526,361 1,328,523,975 1,062,819,180 75,640,210 1,605,660,505 5,439,170,231 1,503,560,340 1,201,345,530 1,805,340,520 Total Current Assets 6,013,296,190 812,956,891 411,698,984 4,386,796,708.00 1,317,388,220 561,903,428 2,281,077,095 601,083,781 3,363,891,508 580,509,006 9,957,696,704.00 103,416,660 Total Assets 2,081,455,705.00 9.395,369,76008,321,331,107.00 Liabilities and Owners Equity A/P Current Portion of LT Debt $422,630,600 147,920,710 570,551,310 $1,011,985,000 341,394,916 1,353,379,916 $1,305,530,320 607,184,919 1,912,715,239 1,509,430,300 651,847,287 2,161,277,587 $1,564,430,450 785,532,620 2,349,963,070 Total Current Liabilities Long-Term Debt Shareholders Equity Total Liabilities & Equities 739,603,550 771,300,845 $2,081,455,705 1,706,974,582 1,326,442,210 S4,386,796,708 3,035,924,595 2,047,729,927 $6,996,369,761 3,259,236,437 2,900,817,082 $8,321,331,107 3,927,663,101 3,680,070,533 9,957,696,704