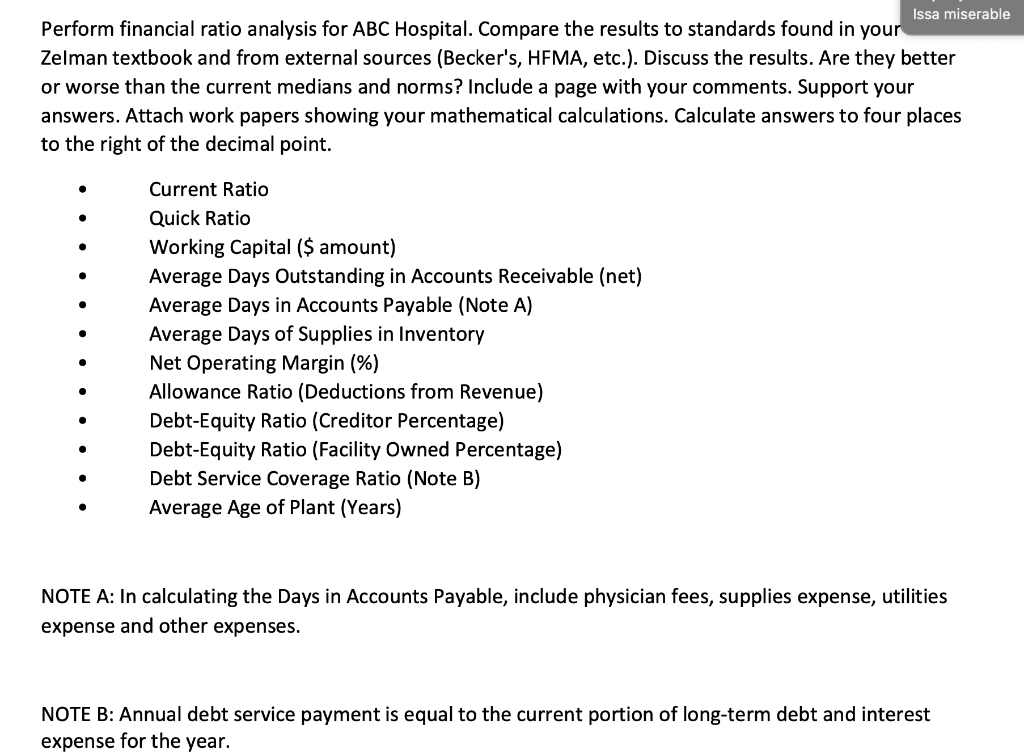
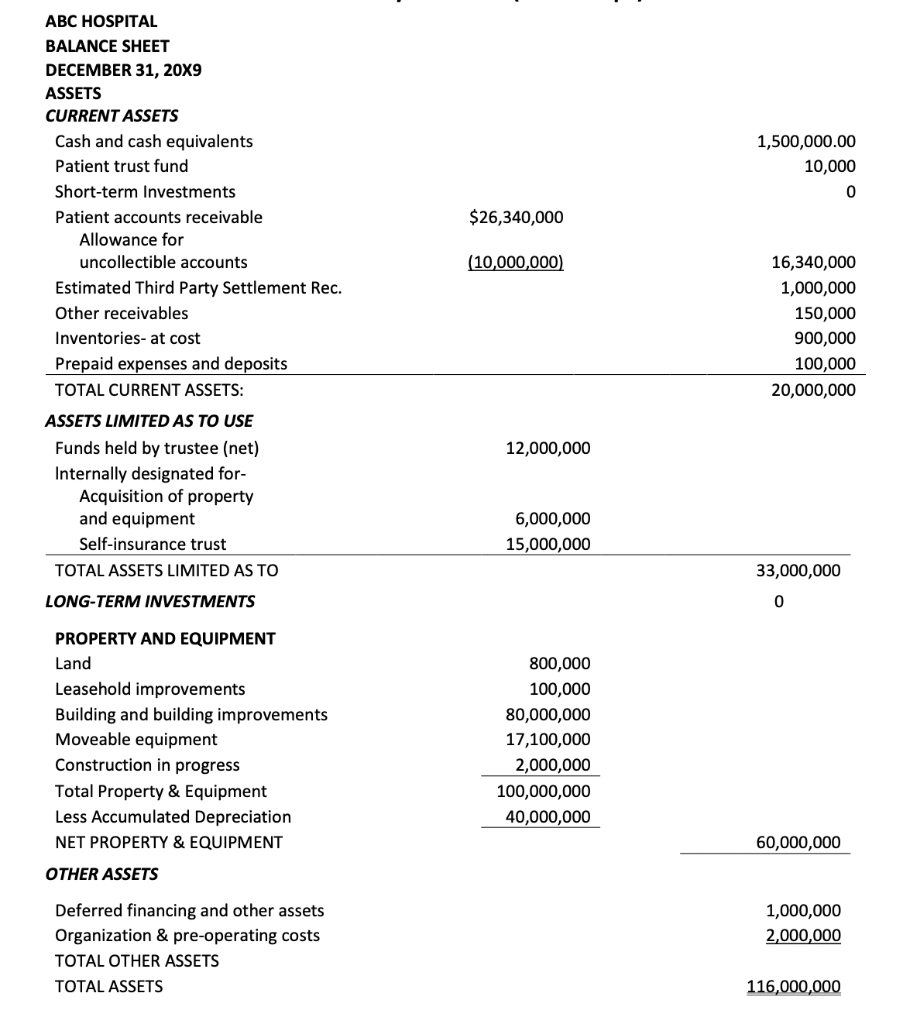
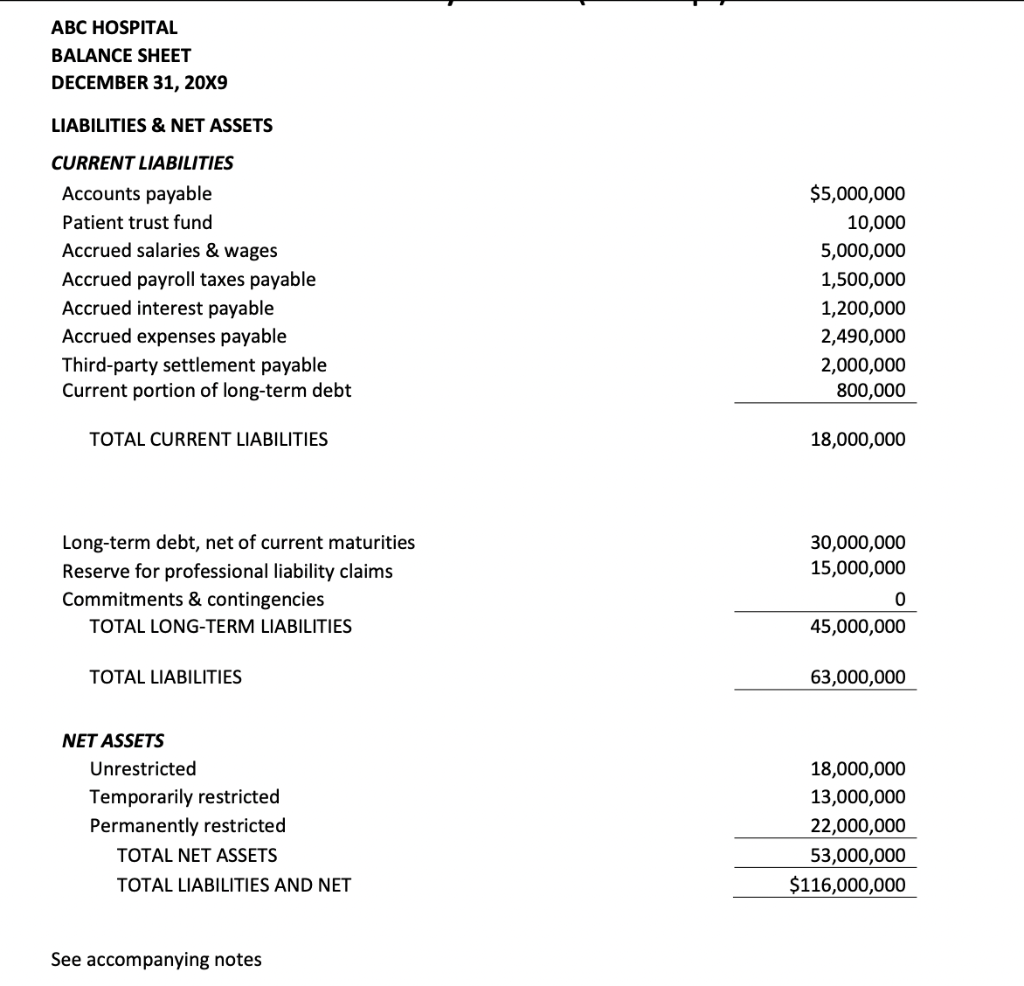
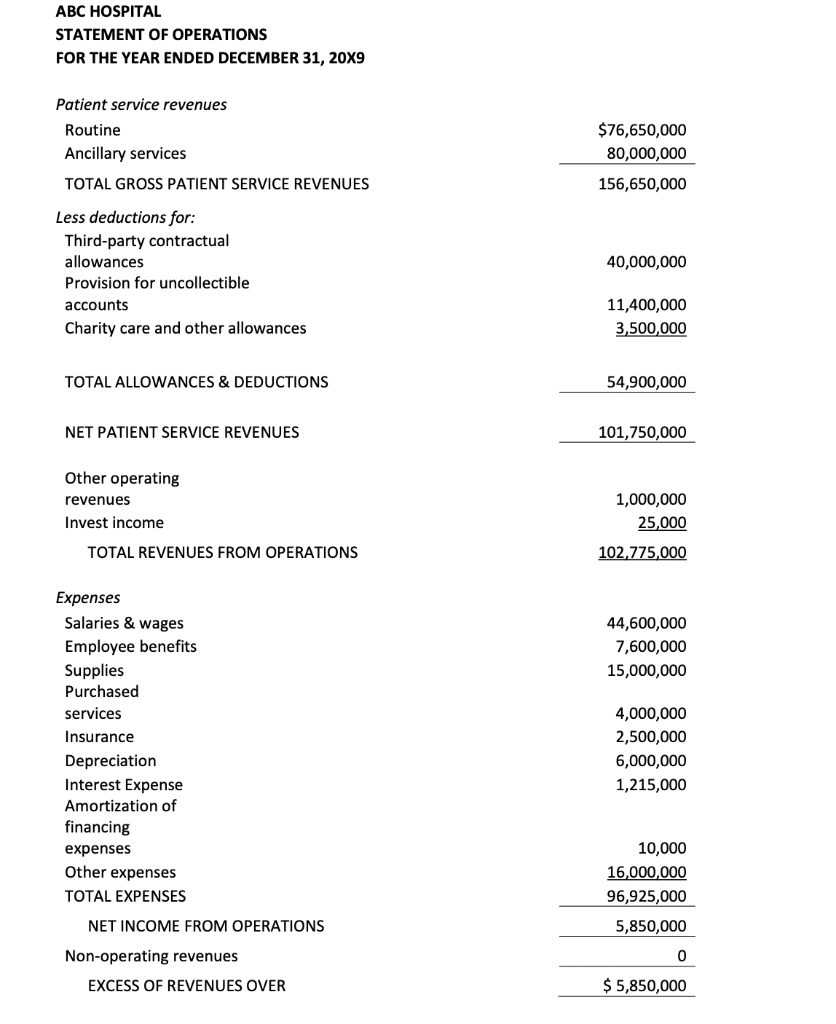
Issa miserable Perform financial ratio analysis for ABC Hospital. Compare the results to standards found in your Zelman textbook and from external sources (Becker's, HFMA, etc.). Discuss the results. Are they better or worse than the current medians and norms? Include a page with your comments. Support your answers. Attach work papers showing your mathematical calculations. Calculate answers to four places to the right of the decimal point. Current Ratio Quick Ratio Working Capital ($ amount) Average Days Outstanding in Accounts Receivable (net) Average Days in Accounts Payable (Note A) Average Days of Supplies in Inventory Net Operating Margin (%) Allowance Ratio (Deductions from Revenue) Debt-Equity Ratio (Creditor Percentage) Debt-Equity Ratio (Facility Owned Percentage) Debt Service Coverage Ratio (Note B) Average Age of Plant (Years) NOTE A: In calculating the Days in Accounts Payable, include physician fees, supplies expense, utilities expense and other expenses. NOTE B: Annual debt service payment is equal to the current portion of long-term debt and interest expense for the year. ABC HOSPITAL BALANCE SHEET DECEMBER 31, 20X9 ASSETS CURRENT ASSETS Cash and cash equivalents Patient trust fund Short-term Investments Patient accounts receivable Allowance for uncollectible accounts Estimated Third Party Settlement Rec. Other receivables Inventories- at cost Prepaid expenses and deposits TOTAL CURRENT ASSETS: ASSETS LIMITED AS TO USE Funds held by trustee (net) Internally designated for- Acquisition of property and equipment Self-insurance trust TOTAL ASSETS LIMITED AS TO LONG-TERM INVESTMENTS PROPERTY AND EQUIPMENT Land Leasehold improvements Building and building improvements Moveable equipment Construction in progress Total Property & Equipment Less Accumulated Depreciation NET PROPERTY & EQUIPMENT OTHER ASSETS Deferred financing and other assets Organization & pre-operating costs TOTAL OTHER ASSETS TOTAL ASSETS $26,340,000 (10,000,000) 12,000,000 6,000,000 15,000,000 800,000 100,000 80,000,000 17,100,000 2,000,000 100,000,000 40,000,000 1,500,000.00 10,000 0 16,340,000 1,000,000 150,000 900,000 100,000 20,000,000 33,000,000 0 60,000,000 1,000,000 2,000,000 116,000,000 ABC HOSPITAL BALANCE SHEET DECEMBER 31, 20X9 LIABILITIES & NET ASSETS CURRENT LIABILITIES Accounts payable Patient trust fund Accrued salaries & wages Accrued payroll taxes payable Accrued interest payable Accrued expenses payable Third-party settlement payable Current portion of long-term debt TOTAL CURRENT LIABILITIES Long-term debt, net of current maturities Reserve for professional liability claims Commitments & contingencies TOTAL LONG-TERM LIABILITIES TOTAL LIABILITIES Unrestricted Temporarily restricted Permanently restricted TOTAL NET ASSETS TOTAL LIABILITIES AND NET NET ASSETS See accompanying notes $5,000,000 10,000 5,000,000 1,500,000 1,200,000 2,490,000 2,000,000 800,000 18,000,000 30,000,000 15,000,000 0 45,000,000 63,000,000 18,000,000 13,000,000 22,000,000 53,000,000 $116,000,000 ABC HOSPITAL STATEMENT OF OPERATIONS FOR THE YEAR ENDED DECEMBER 31, 20X9 Patient service revenues Routine Ancillary services TOTAL GROSS PATIENT SERVICE REVENUES Less deductions for: Third-party contractual allowances Provision for uncollectible accounts Charity care and other allowances TOTAL ALLOWANCES & DEDUCTIONS NET PATIENT SERVICE REVENUES Other operating revenues Invest income TOTAL REVENUES FROM OPERATIONS Expenses Salaries & wages Employee benefits Supplies Purchased services Insurance Depreciation Interest Expense Amortization of financing expenses Other expenses TOTAL EXPENSES NET INCOME FROM OPERATIONS EXCESS OF REVENUES OVER Non-operating revenues $76,650,000 80,000,000 156,650,000 40,000,000 11,400,000 3,500,000 54,900,000 101,750,000 1,000,000 25,000 102,775,000 44,600,000 7,600,000 15,000,000 4,000,000 2,500,000 6,000,000 1,215,000 10,000 16,000,000 96,925,000 5,850,000 0 $ 5,850,000 Issa miserable Perform financial ratio analysis for ABC Hospital. Compare the results to standards found in your Zelman textbook and from external sources (Becker's, HFMA, etc.). Discuss the results. Are they better or worse than the current medians and norms? Include a page with your comments. Support your answers. Attach work papers showing your mathematical calculations. Calculate answers to four places to the right of the decimal point. Current Ratio Quick Ratio Working Capital ($ amount) Average Days Outstanding in Accounts Receivable (net) Average Days in Accounts Payable (Note A) Average Days of Supplies in Inventory Net Operating Margin (%) Allowance Ratio (Deductions from Revenue) Debt-Equity Ratio (Creditor Percentage) Debt-Equity Ratio (Facility Owned Percentage) Debt Service Coverage Ratio (Note B) Average Age of Plant (Years) NOTE A: In calculating the Days in Accounts Payable, include physician fees, supplies expense, utilities expense and other expenses. NOTE B: Annual debt service payment is equal to the current portion of long-term debt and interest expense for the year. ABC HOSPITAL BALANCE SHEET DECEMBER 31, 20X9 ASSETS CURRENT ASSETS Cash and cash equivalents Patient trust fund Short-term Investments Patient accounts receivable Allowance for uncollectible accounts Estimated Third Party Settlement Rec. Other receivables Inventories- at cost Prepaid expenses and deposits TOTAL CURRENT ASSETS: ASSETS LIMITED AS TO USE Funds held by trustee (net) Internally designated for- Acquisition of property and equipment Self-insurance trust TOTAL ASSETS LIMITED AS TO LONG-TERM INVESTMENTS PROPERTY AND EQUIPMENT Land Leasehold improvements Building and building improvements Moveable equipment Construction in progress Total Property & Equipment Less Accumulated Depreciation NET PROPERTY & EQUIPMENT OTHER ASSETS Deferred financing and other assets Organization & pre-operating costs TOTAL OTHER ASSETS TOTAL ASSETS $26,340,000 (10,000,000) 12,000,000 6,000,000 15,000,000 800,000 100,000 80,000,000 17,100,000 2,000,000 100,000,000 40,000,000 1,500,000.00 10,000 0 16,340,000 1,000,000 150,000 900,000 100,000 20,000,000 33,000,000 0 60,000,000 1,000,000 2,000,000 116,000,000 ABC HOSPITAL BALANCE SHEET DECEMBER 31, 20X9 LIABILITIES & NET ASSETS CURRENT LIABILITIES Accounts payable Patient trust fund Accrued salaries & wages Accrued payroll taxes payable Accrued interest payable Accrued expenses payable Third-party settlement payable Current portion of long-term debt TOTAL CURRENT LIABILITIES Long-term debt, net of current maturities Reserve for professional liability claims Commitments & contingencies TOTAL LONG-TERM LIABILITIES TOTAL LIABILITIES Unrestricted Temporarily restricted Permanently restricted TOTAL NET ASSETS TOTAL LIABILITIES AND NET NET ASSETS See accompanying notes $5,000,000 10,000 5,000,000 1,500,000 1,200,000 2,490,000 2,000,000 800,000 18,000,000 30,000,000 15,000,000 0 45,000,000 63,000,000 18,000,000 13,000,000 22,000,000 53,000,000 $116,000,000 ABC HOSPITAL STATEMENT OF OPERATIONS FOR THE YEAR ENDED DECEMBER 31, 20X9 Patient service revenues Routine Ancillary services TOTAL GROSS PATIENT SERVICE REVENUES Less deductions for: Third-party contractual allowances Provision for uncollectible accounts Charity care and other allowances TOTAL ALLOWANCES & DEDUCTIONS NET PATIENT SERVICE REVENUES Other operating revenues Invest income TOTAL REVENUES FROM OPERATIONS Expenses Salaries & wages Employee benefits Supplies Purchased services Insurance Depreciation Interest Expense Amortization of financing expenses Other expenses TOTAL EXPENSES NET INCOME FROM OPERATIONS EXCESS OF REVENUES OVER Non-operating revenues $76,650,000 80,000,000 156,650,000 40,000,000 11,400,000 3,500,000 54,900,000 101,750,000 1,000,000 25,000 102,775,000 44,600,000 7,600,000 15,000,000 4,000,000 2,500,000 6,000,000 1,215,000 10,000 16,000,000 96,925,000 5,850,000 0 $ 5,850,000


