

Answered step by step
Verified Expert Solution
Question
1 Approved Answer
ist , K Portfolio analysis You have been given the expected return data shown in the first table on three assets - F , G
ist
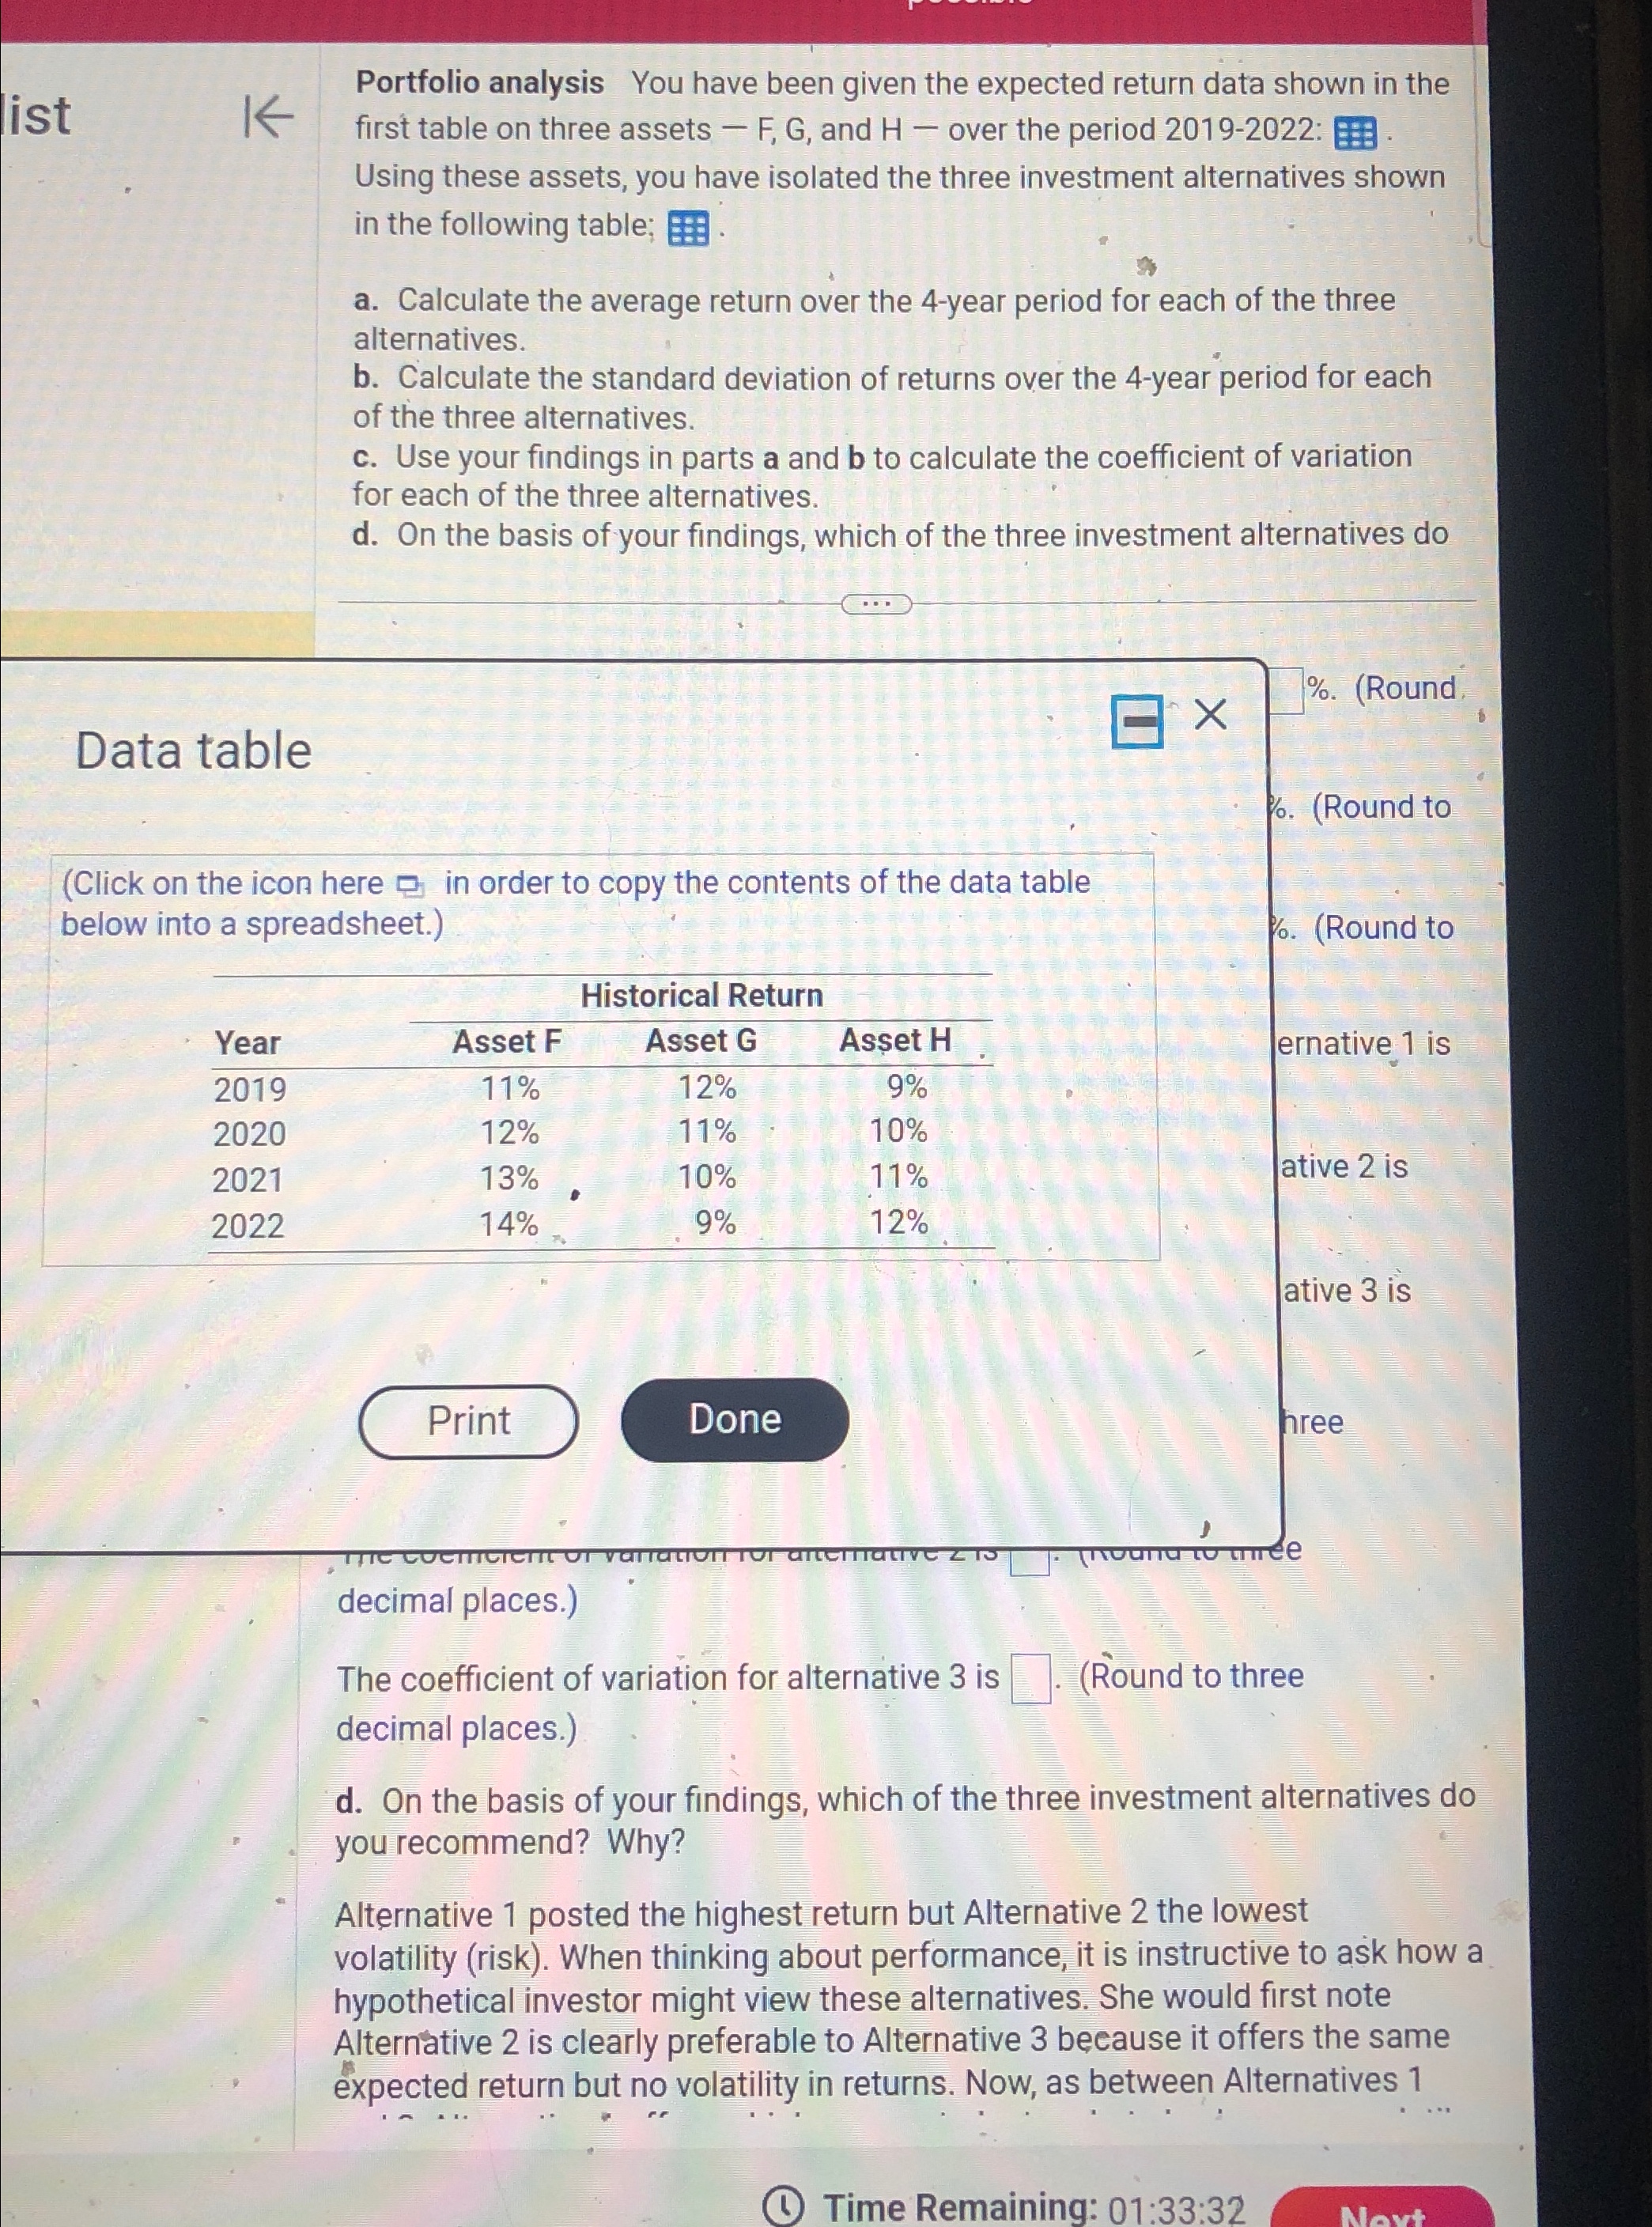
Portfolio analysis You have been given the expected return data shown in the first table on three assets F G and H over the period : Using these assets, you have isolated the three investment alternatives shown in the following table;
a Calculate the average return over the year period for each of the three alternatives.
b Calculate the standard deviation of returns over the year period for each of the three alternatives.
c Use your findings in parts a and to calculate the coefficient of variation for each of the three alternatives.
d On the basis of your findings, which of the three investment alternatives do
Data table Round
Click on the icon here in order to copy the contents of the data table below into a spreadsheet.
Round to
tableHistorical ReturnYearAsset FAsset GAsset H
Step by Step Solution
There are 3 Steps involved in it
Step: 1

Get Instant Access to Expert-Tailored Solutions
See step-by-step solutions with expert insights and AI powered tools for academic success
Step: 2

Step: 3
Ace Your Homework with AI
Get the answers you need in no time with our AI-driven, step-by-step assistance
Get Started
Term Structure Models A Graduate Course
Authors: Damir Filipovic
2009th Edition
364226915X, 978-3642269158