

Question
It is believed that educational attainment is higher in countries with higher expenditure on education as a percentage of GDP. Assuming that there is a
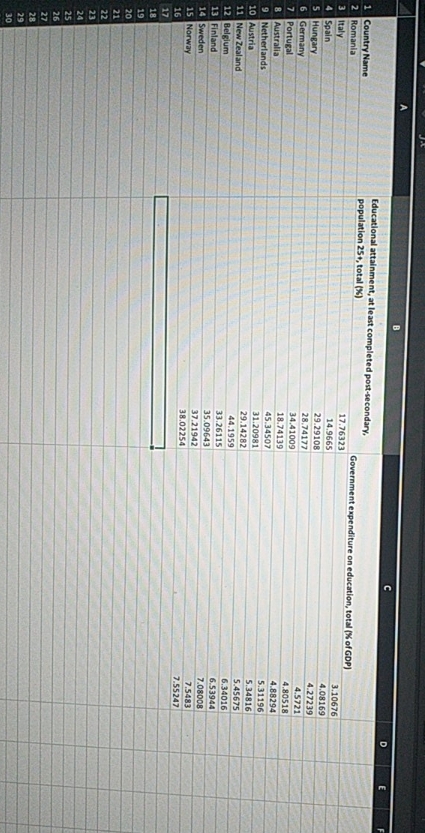
It is believed that educational attainment is higher in countries with higher expenditure on education as a percentage of GDP. Assuming that there is a linear relationship between expenditure on education as a percentage of GDP and percentage of labour force (over 25 years old) with at least post-secondary education for 14 countries in the World Socioeconomic Data, answer the following questions using the dataset labour force2015.xlsx.(a) Calculate the sample correlation coefficient for the data. Comment on its value.(b) Explain your choice of independent and dependent variables.(c) Let y = Percentage of labour force with at least post-secondary education and x = Expenditure on education as percentage of GDP. Use the Excel Data Analysis Add-in to regress y on x. Interpret the regression coefficients. (d) Plot the data and add the estimated regression line. (e) Find the coefficient of determination (R2) for the above estimated regression line and give a full interpretation of the value. (f) Perform a hypothesis test at the 5% significance level for the gradient of the regression line and draw conclusions about whether there is evidence for a relationship between Expenditure on education as percentage of GDP and Percentage of labour force with at least post-secondary education. (g) Produce appropriate plots of the regression residuals to assess the assumptions of the regression model. Consider if there are any patterns in the residuals, which might suggest ways to improve the model. For example, are the residuals normally distributed and do they have constant variance? (h) Predict the percentage of the labour force with at least post-secondary education for Argentina based on the fact that the country's expenditure on education in 2015 was 5.78% of GDP. Produce a 95% confidence interval for this prediction
Step by Step Solution
There are 3 Steps involved in it
Step: 1

Get Instant Access to Expert-Tailored Solutions
See step-by-step solutions with expert insights and AI powered tools for academic success
Step: 2

Step: 3
Ace Your Homework with AI
Get the answers you need in no time with our AI-driven, step-by-step assistance
Get Started
Precalculus
Authors: Michael Sullivan
10th Global Edition
1292121772, 1292121777, 978-1292121772