Question
It is decided to use an AR model (a linear prediction model) of an observed signal x(n) in order to estimate the signals power spectral
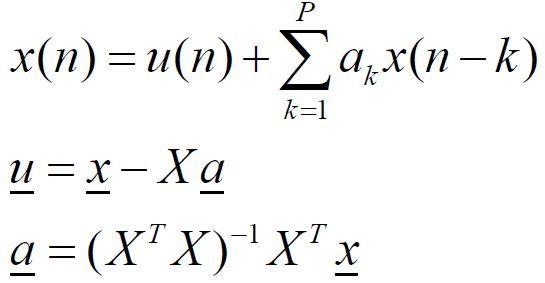
It is decided to use an AR model (a linear prediction model) of an observed signal x(n) in order to estimate the signals power spectral density. The model linear prediction parameters will be determined using least squares analysis, based on the equations:


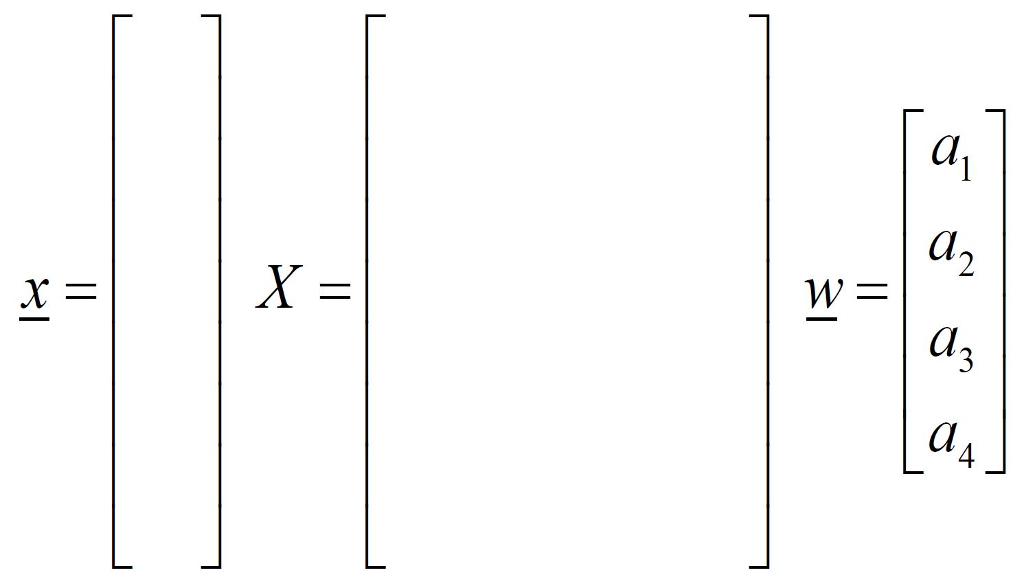
1. In a particular experiment we observe x(n) = 1.0, 1.1, 1.2, 1.3, 1.4, 1.5, 1.6, 1.7, 1.8, 1.9 for n = 0, 1, 2, 3, 4, 5, 6, 7, 8, 9 respectively. Fill in specific numeric values for the vector x and the matrix X in the above equations, assuming that we want to use the available data (only the available data described) to compute the coefficients a for a linear prediction model with P = 4.

2. Assume that after correctly performing the least squares solution above, you get the result:
a = [ 1.2 -0.4 0.6 -0.2]
Write out the explicit Z-domain transfer function HAR(z) for the above signal model, where X(z) = Har(z) U(z). Be sure to include the specific numerical coefficients rather than generic symbolic coefficients. Har(z) =
3. It is desired to use the MATLAB freqz() function to estimate the frequency response Har(w) of the filter in the AR model, where w represents normalized frequency in radians. This MATLAB function has the general form: [Har, w] = freqz(B, A, N);
Where B is a vector representing the numerator of Har(z), A is a vector representing the denominator of Har(z), and N is the number of points at which you want to evaluate Har(w) (evenly spaced between w = 0 and the Nyquist frequency w=pi). In the MATLAB result, Har is the vector of computed frequency responses and w is the corresponding vector of normalized frequencies. Fill in the actual vector numeric values for the MATLAB variables B and A, assuming the specific AR model solution in part b above.
B =[ ] A=[ ]
4. It is desired to use the MATLAB filter() and var() functions to estimate the variance of the AR models hypothetical input function u(n) assuming the specific AR model solution in part b above. These functions have the general form: u = filter(Bu, Au, x); var_u = var(u);
Where Bu is a vector representing the numerator of Hu(z), and Au is a vector representing the denominator of Hu(z), where U(z) = Hu(z) X(z). Fill in the actual vector numeric values for Bu and Au, assuming the AR model solution in part b above.
Bu =[ ] Au =[ ]
5. It is desired to use the MATLAB semilogy() function to display the estimate of the power spectral density of the observed signal x, based on the AR model formulated above. This function has the general form:
semilogy(w, Pxx);
Where Pxx is a vector representing the power spectral density of x estimated at the normalized frequencies in the vector w. Complete the MATLAB expression to compute Pxx based on Har and var_u as computed in parts 3. and 4. above.
Pxx =
u (n) AR Model x(n)
Step by Step Solution
There are 3 Steps involved in it
Step: 1

Get Instant Access to Expert-Tailored Solutions
See step-by-step solutions with expert insights and AI powered tools for academic success
Step: 2

Step: 3

Ace Your Homework with AI
Get the answers you need in no time with our AI-driven, step-by-step assistance
Get Started


