Answered step by step
Verified Expert Solution
Link Copied!

Question

1 Approved Answer

It was suggested to the retailer that the 200 transaction values could also be summarised in a grouped table (see Table 2 below). Table 2

It was suggested to the retailer that the 200 transaction values could also be summarised in a grouped table (see Table 2 below). Table 2 have been made available in the Excel file named MN4063QANOVS22CWK1 Data under the worksheet named Task 2. Required for Task 2 (50 words Max)

a. Using the two table templates provided in the Excel data file named MN4063QANOVS22CWK1Data under the tab labelled Task 2: Complete table 2a to show the percentage frequencies, cumulative frequencies and cumulative percentage frequencies columns. [1+1+1 = 3marks]. Round all answers to the nearest whole number Complete table 2b and use your results to estimate the mean and the standard deviation. [10 +2+2 = 14marks]. Round all answers to the nearest whole number (Copy the Excel output (2 tables) and paste it into your Word document)
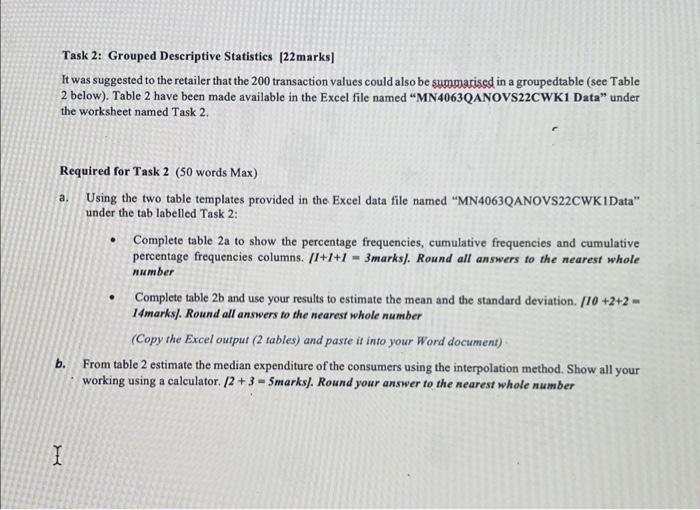
image text in transcribedimage text in transcribedb. From table 2 estimate the median expenditure of the consumers using the interpolation method. Show all your working using a calculator. [2 + 3 = 5marks]. Round your answer to the nearest whole number

Task 2: Grouped Descriptive Statistics [22marks] It was suggested to the retailer that the 200 transaction values could also be sumparised in a groupedtable (see Table 2 below). Table 2 have been made available in the Excel file named "MN4063QANOVS22CWK1 Data" under the worksheet named Task 2. Required for Task 2 ( 50 words Max) a. Using the two table templates provided in the. Excel data file named "MN4063QANOVS22CWK1Data" under the tab labelled Task 2: - Complete table 2 a to show the percentage frequencies, cumulative frequencies and cumulative percentage frequencies columns. [I+I+I=3 marks]. Round all answers to the nearest whole number - Complete table 2b and use your results to estimate the mean and the standard deviation. [10+2+2= 14marks]. Round all answers to the nearest whole number (Copy the Excel output (2 tables) and paste it into your Word document) b. From table 2 estimate the median expenditure of the consumers using the interpolation method. Show all your working using a calculator. [2+3=5 marks). Round your answer to the nearest whole number Task 2: Grouped Descriptive Statistics [22marks] It was suggested to the retailer that the 200 transaction values could also be sumparised in a groupedtable (see Table 2 below). Table 2 have been made available in the Excel file named "MN4063QANOVS22CWK1 Data" under the worksheet named Task 2. Required for Task 2 ( 50 words Max) a. Using the two table templates provided in the. Excel data file named "MN4063QANOVS22CWK1Data" under the tab labelled Task 2: - Complete table 2 a to show the percentage frequencies, cumulative frequencies and cumulative percentage frequencies columns. [I+I+I=3 marks]. Round all answers to the nearest whole number - Complete table 2b and use your results to estimate the mean and the standard deviation. [10+2+2= 14marks]. Round all answers to the nearest whole number (Copy the Excel output (2 tables) and paste it into your Word document) b. From table 2 estimate the median expenditure of the consumers using the interpolation method. Show all your working using a calculator. [2+3=5 marks). Round your answer to the nearest whole number

Step by Step Solution

There are 3 Steps involved in it

Step: 1

blur-text-image

Get Instant Access to Expert-Tailored Solutions

See step-by-step solutions with expert insights and AI powered tools for academic success

Step: 2

blur-text-image_2

Step: 3

blur-text-image_3

Ace Your Homework with AI

Get the answers you need in no time with our AI-driven, step-by-step assistance

Get Started

Recommended Textbook for

Study Guide To Accompany Financial Accounting In An Economic Context

Authors: Jamie Pratt

6th Edition

0471731110, 978-0471731115

More Books

Students also viewed these Accounting questions