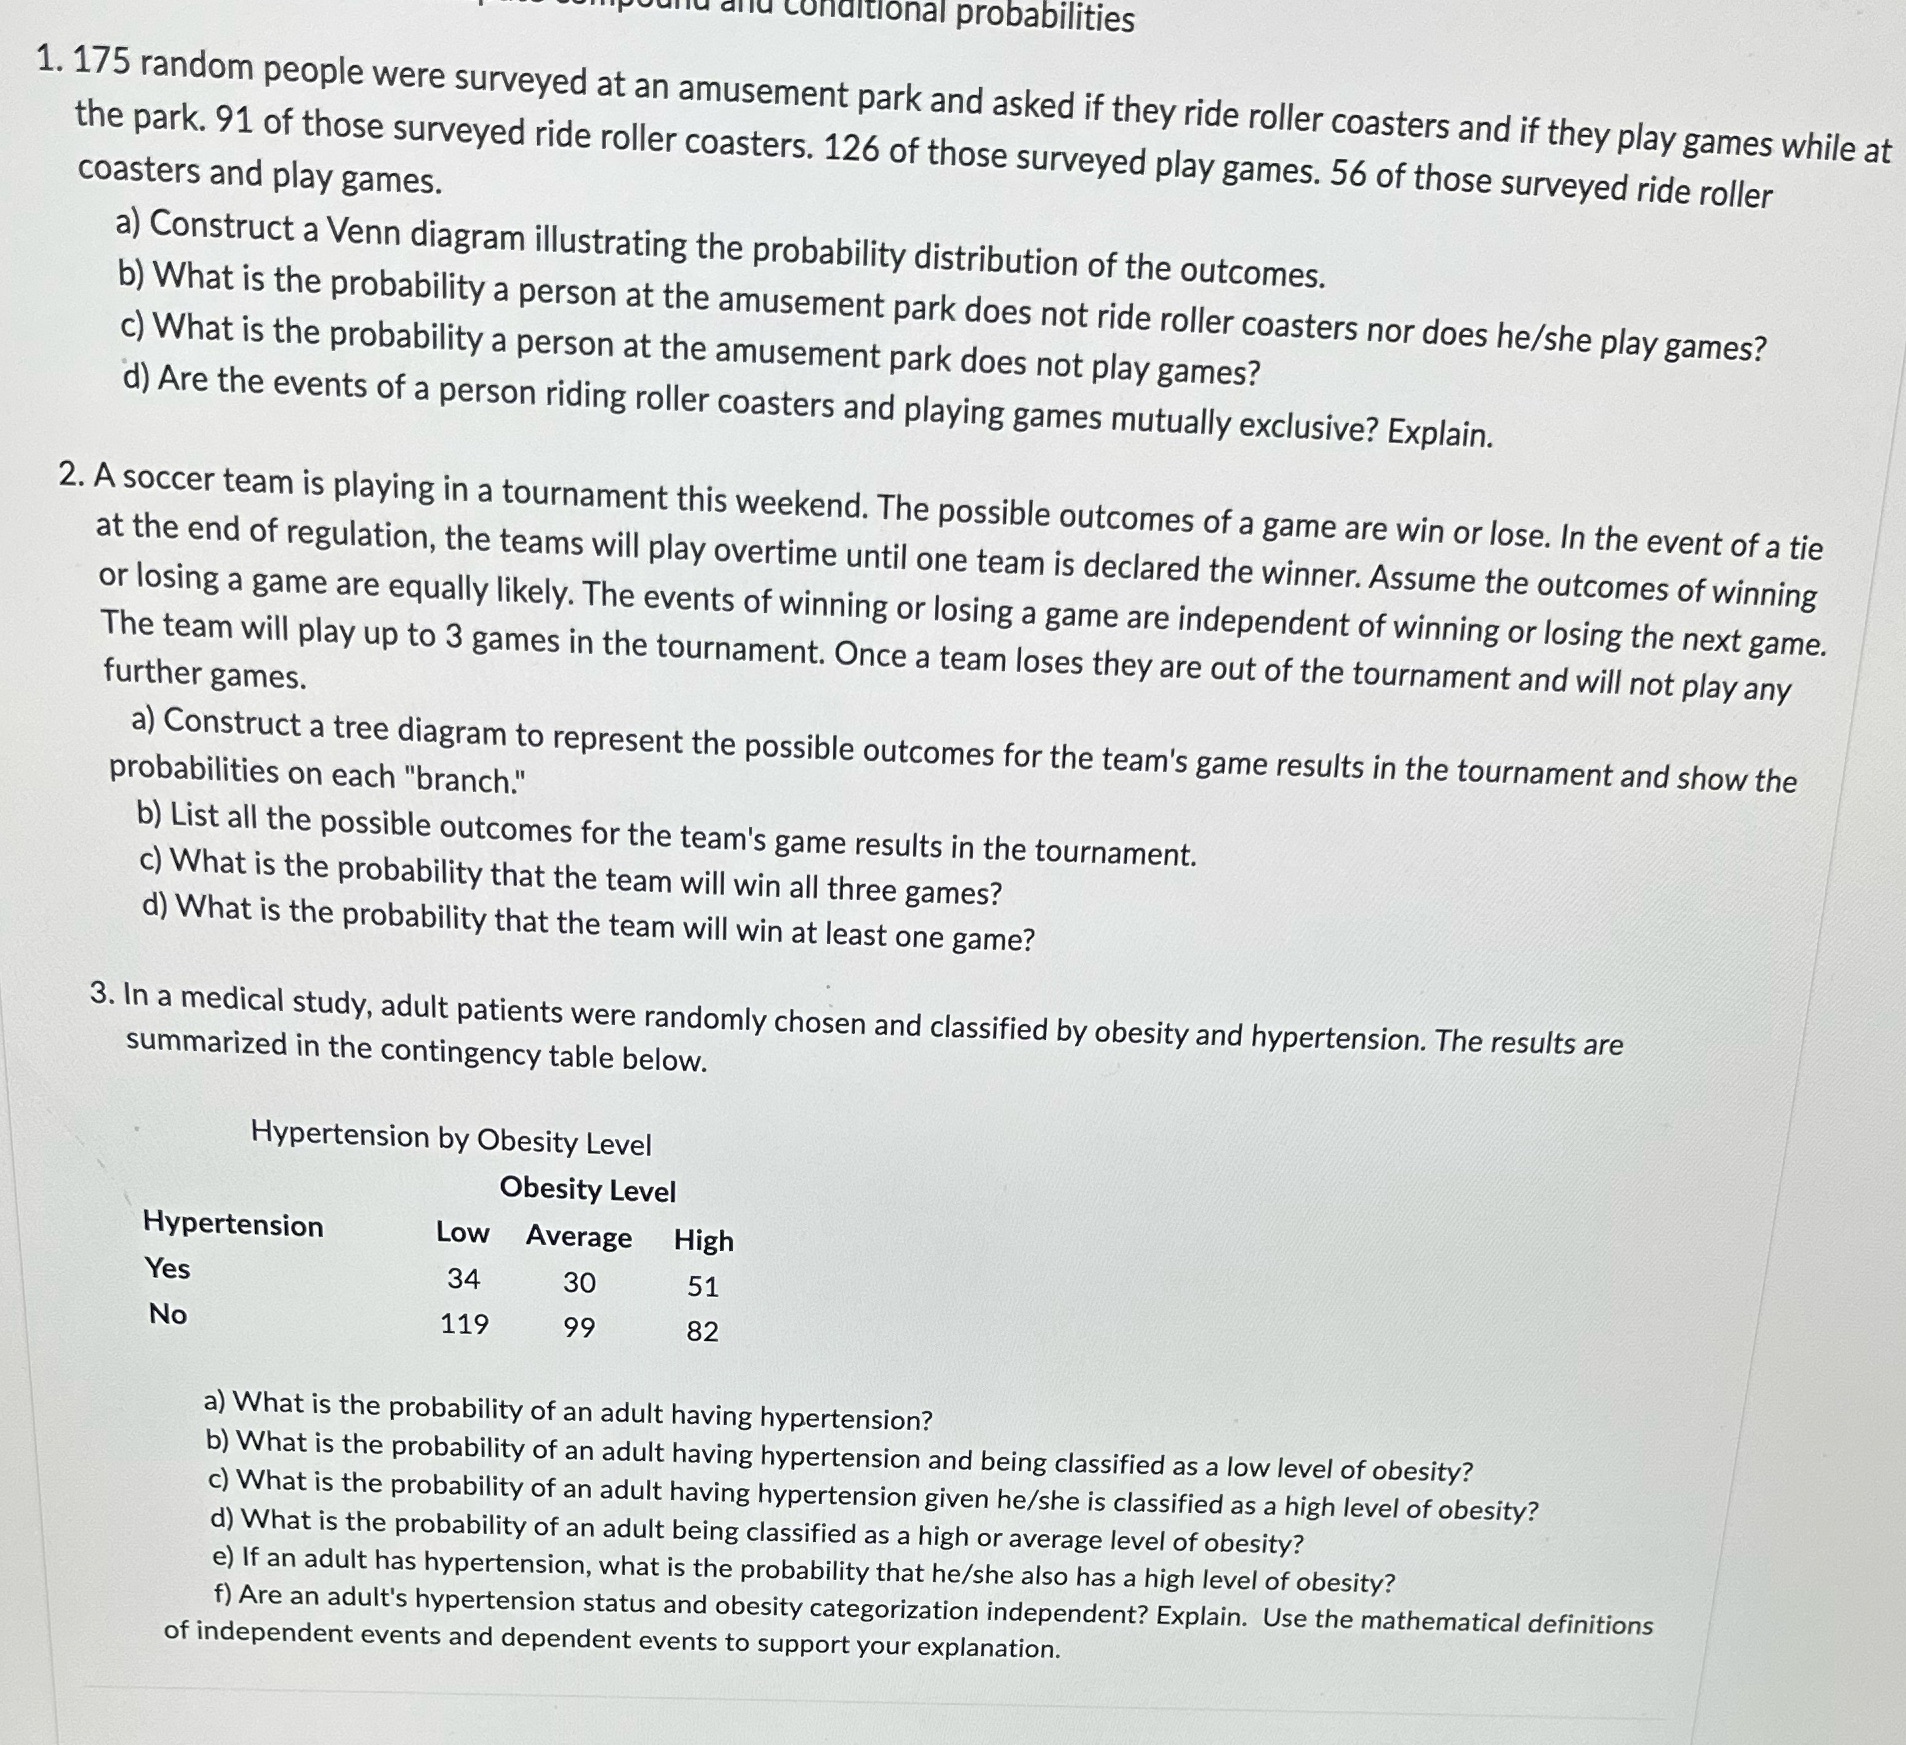
itional probabilities 1. 175 random people were surveyed at an amusement park and asked if they ride roller coasters and if they play games while at the park. 91 of those surveyed ride roller coasters. 126 of those surveyed play games. 56 of those surveyed ride roller coasters and play games. a) Construct a Venn diagram illustrating the probability distribution of the outcomes. b) What is the probability a person at the amusement park does not ride roller coasters nor does he/she play games? c) What is the probability a person at the amusement park does not play games? d) Are the events of a person riding roller coasters and playing games mutually exclusive? Explain. 2. A soccer team is playing in a tournament this weekend. The possible outcomes of a game are win or lose. In the event of a tie at the end of regulation, the teams will play overtime until one team is declared the winner. Assume the outcomes of winning or losing a game are equally likely. The events of winning or losing a game are independent of winning or losing the next game. The team will play up to 3 games in the tournament. Once a team loses they are out of the tournament and will not play any further games. a) Construct a tree diagram to represent the possible outcomes for the team's game results in the tournament and show the probabilities on each "branch." b) List all the possible outcomes for the team's game results in the tournament. c) What is the probability that the team will win all three games? d) What is the probability that the team will win at least one game? 3. In a medical study, adult patients were randomly chosen and classified by obesity and hypertension. The results are summarized in the contingency table below. Hypertension by Obesity Level Obesity Level Hypertension Low Average High Yes 34 30 51 No 119 99 82 a) What is the probability of an adult having hypertension? b) What is the probability of an adult having hypertension and being classified as a low level of obesity? c) What is the probability of an adult having hypertension given he/she is classified as a high level of obesity? d) What is the probability of an adult being classified as a high or average level of obesity? e) If an adult has hypertension, what is the probability that he/she also has a high level of obesity? f) Are an adult's hypertension status and obesity categorization independent? Explain. Use the mathematical definitions of independent events and dependent events to support your explanation


