

Answered step by step
Verified Expert Solution
Question
1 Approved Answer
Its a Matlab question, Thank you! Suppose we have a vector with the following values [ 7 410.5 0.1 ). These are fictitious values recording
Its a Matlab question, Thank you! 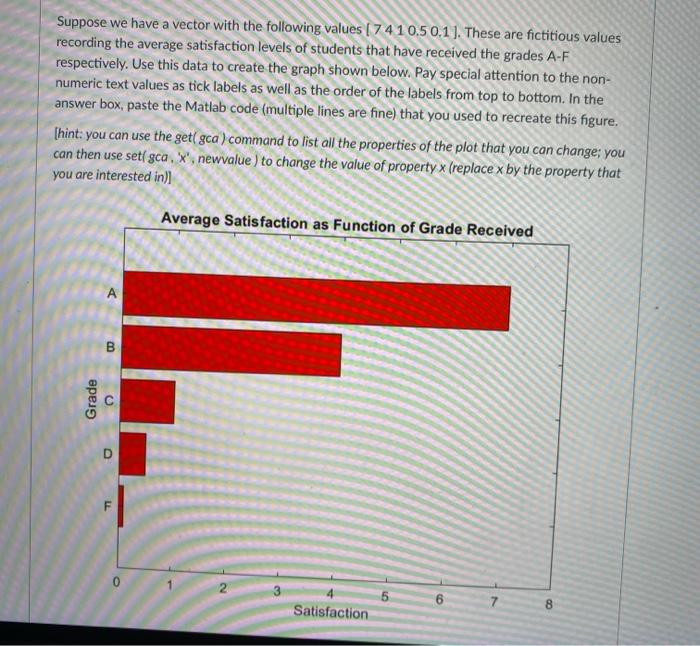
Suppose we have a vector with the following values [ 7 410.5 0.1 ). These are fictitious values recording the average satisfaction levels of students that have received the grades A-F respectively. Use this data to create the graph shown below. Pay special attention to the non- numeric text values as tick labels as well as the order of the labels from top to bottom. In the answer box, paste the Matlab code (multiple lines are fine) that you used to recreate this figure. (hint: you can use the geti gca) command to list all the properties of the plot that you can change; you can then use set(gca, X', newvalue ) to change the value of property x (replace x by the property that you are interested in) Average Satisfaction as Function of Grade Received A B Grade F 1 7 Satisfaction 8 Step by Step Solution
There are 3 Steps involved in it
Step: 1

Get Instant Access to Expert-Tailored Solutions
See step-by-step solutions with expert insights and AI powered tools for academic success
Step: 2

Step: 3
Ace Your Homework with AI
Get the answers you need in no time with our AI-driven, step-by-step assistance
Get Started
Database Management For Business Leaders Building And Using Data Solutions That Work For You
Authors: Larry Ruddell
1st Edition
1973630249, 978-1973630241