

Question
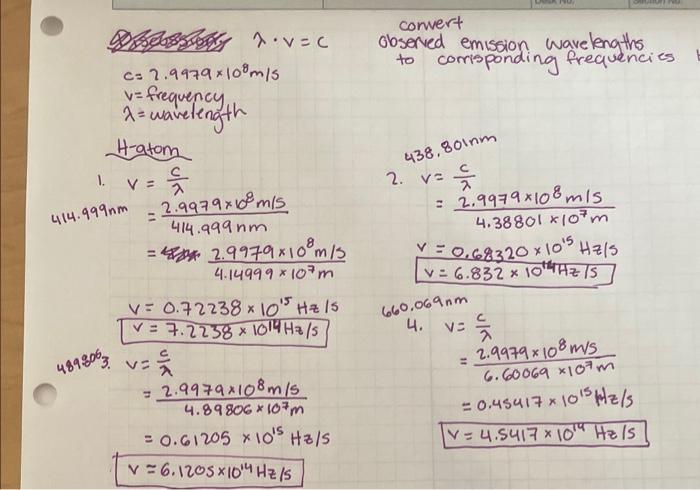
ive already found the frequencies for my graph but idk how to graph my findings. can someobe help? Also, what is my found Rydberg constant?
ive already found the frequencies for my graph but idk how to graph my findings. can someobe help? Also, what is my found Rydberg constant?
Step by Step Solution
There are 3 Steps involved in it
Step: 1

Get Instant Access to Expert-Tailored Solutions
See step-by-step solutions with expert insights and AI powered tools for academic success
Step: 2

Step: 3
Ace Your Homework with AI
Get the answers you need in no time with our AI-driven, step-by-step assistance
Get Started
Macroeconomics Principles Applications And Tools
Authors: Arthur O Sullivan, Steven M. Sheffrin, Stephen J. Perez
7th Edition
978-0134089034, 9780134062754, 134089030, 134062752, 978-0132555234