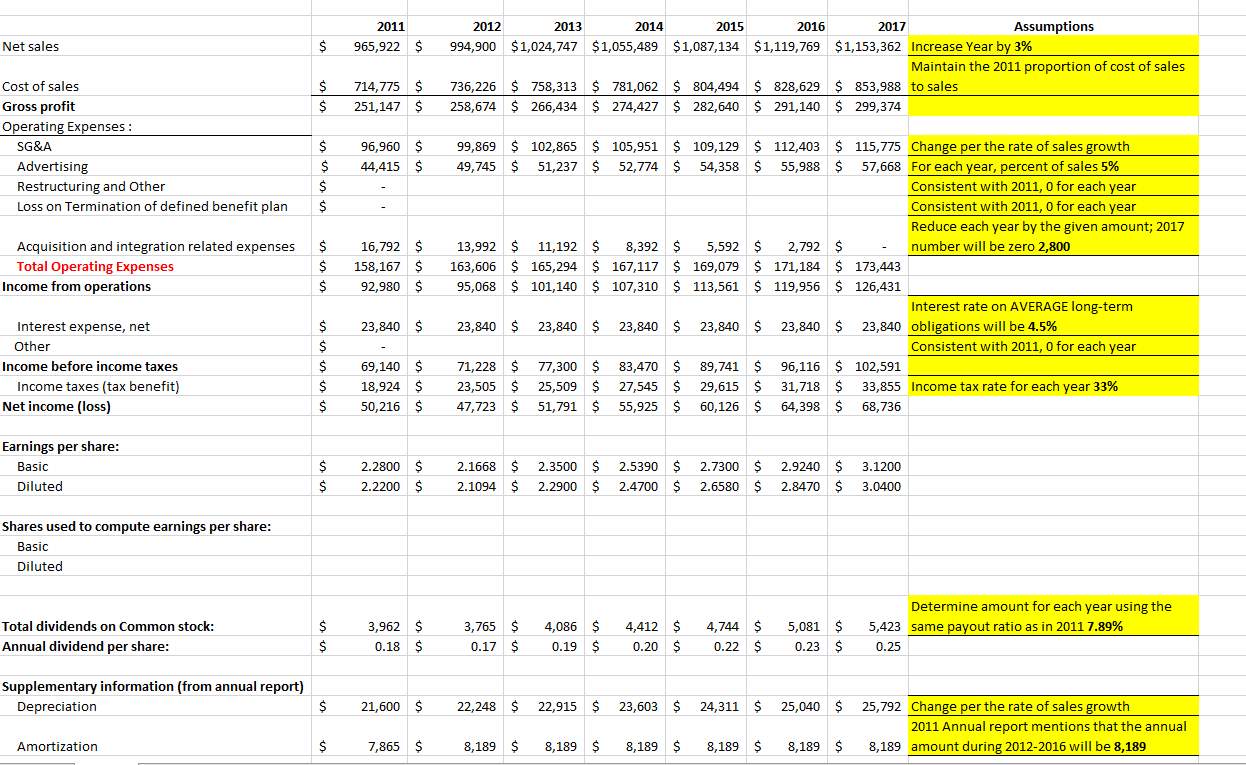
I've included a copy of my forecasted P&L for reference. I need to Forecast the below balance sheet with the following assumptions indicated on the right.
I included formulas to compute the totals however I've noticed that my balance sheet is out of balance (but these are the figures I was given)
I need help inserting the formulas for the assumptions given to forecast from 2011 (original data) to 2017 (forecasted data) Can you please help me with this ? (please show calculations so I can learn)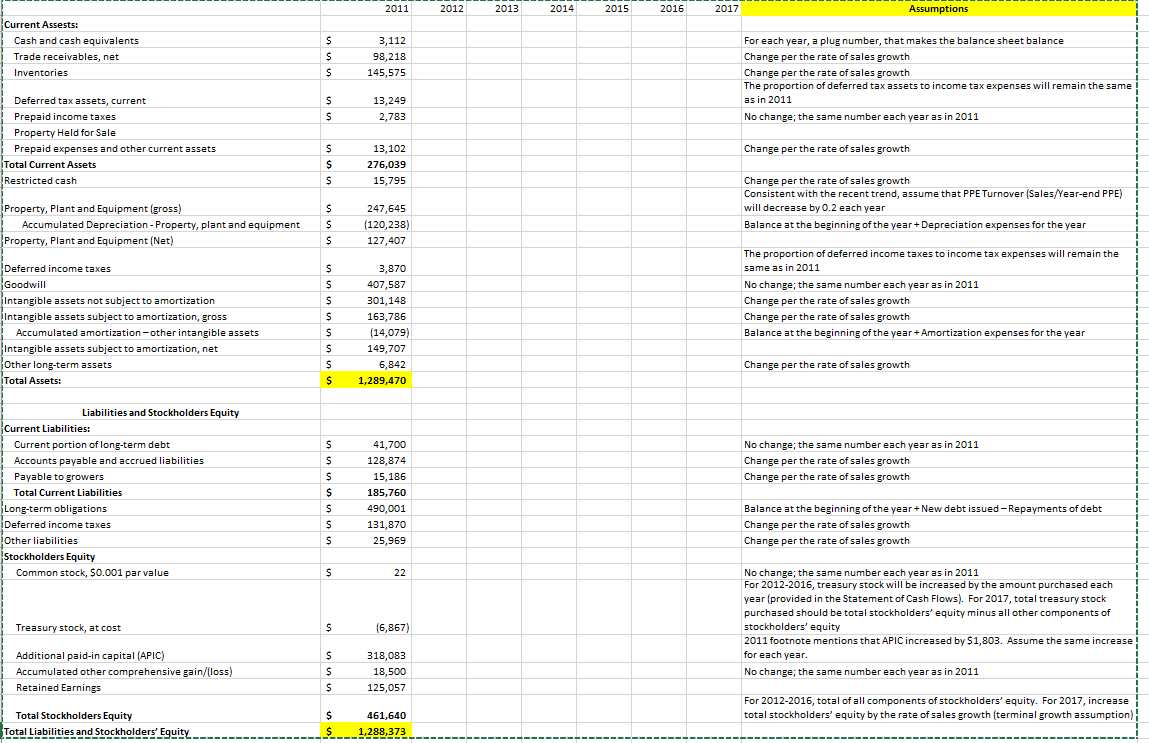
2011 2012 2013 2014 2015 2016 2017 Assumptions Current Assests: Cash and cash equivalents Trade receivables, net ! Inventories 3,112 98,218 145,575 For each year, a plug number, that makes the balance sheet balance Change per the rate of sales growth Change per the rate of sales growth The proportion of deferred tax assets to income tax expenses will remain the same as in 2011 No change; the same number each year as in 2011 13,249 2,783 Deferred tax assets, current Prepaid income taxes Property Held for Sale Prepaid expenses and other current assets Total Current Assets Restricted cash Change per the rate of sales growth 13,102 276,039 15,795 Property, Plant and Equipment (gross) Accumulated Depreciation - Property, plant and equipment Property, Plant and Equipment (Net) 247,645 (120,238) 127,407 Change per the rate of sales growth Consistent with the recent trend, assume that PPE Turnover (Sales/Year-end PPE) will decrease by 0.2 each year Balance at the beginning of the year + Depreciation expenses for the year Deferred income taxes Goodwill Intangible assets not subject to amortization Intangible assets subject to amortization, gross Accumulated amortization-other intangible assets Intangible assets subject to amortization, net Other long-term assets Total Assets: 3,870 407,587 301,148 163,786 (14,079) 149,707 6,842 1,289,470 The proportion of deferred income taxes to income tax expenses will remain the same as in 2011 No change; the same number each year as in 2011 Change per the rate of sales growth Change per the rate of sales growth Balance at the beginning of the year + Amortization expenses for the year S Change per the rate of sales growth $ $ $ No change; the same number each year as in 2011 Change per the rate of sales growth Change per the rate of sales growth Liabilities and Stockholders Equity Current Liabilities: Current portion of long-term debt Accounts payable and accrued liabilities Payable to growers Total Current Liabilities Long-term obligations Deferred income taxes Other liabilities Stockholders Equity | Common stock, $0.001 par value 41,700 128,874 15,186 185,760 490,001 131,870 25,969 $ Balance at the beginning of the year +New debt issued - Repayments of debt Change per the rate of sales growth Change per the rate of sales growth $ $ 22 Treasury stock, at cost (6,867) No change; the same number each year as in 2011 For 2012-2016, treasury stock will be increased by the amount purchased each year (provided in the Statement of Cash Flows). For 2017, total treasury stock purchased should be total stockholders' equity minus all other components of stockholders' equity 2011 footnote mentions that APIC increased by $1,803. Assume the same increase! for each year. No change; the same number each year as in 2011 Additional paid-in capital (APIC) Accumulated other comprehensive gain/loss) | Retained Earnings 318,083 18,500 125,057 For 2012-2016, total of all components of stockholders' equity. For 2017, increase total stockholders' equity by the rate of sales growth (terminal growth assumption) | Total Stockholders Equity Total Liabilities and Stockholders' Equity 461,640 --- 1,288,373 2011 2012 2013 2014 2015 2016 2017 Assumptions Current Assests: Cash and cash equivalents Trade receivables, net ! Inventories 3,112 98,218 145,575 For each year, a plug number, that makes the balance sheet balance Change per the rate of sales growth Change per the rate of sales growth The proportion of deferred tax assets to income tax expenses will remain the same as in 2011 No change; the same number each year as in 2011 13,249 2,783 Deferred tax assets, current Prepaid income taxes Property Held for Sale Prepaid expenses and other current assets Total Current Assets Restricted cash Change per the rate of sales growth 13,102 276,039 15,795 Property, Plant and Equipment (gross) Accumulated Depreciation - Property, plant and equipment Property, Plant and Equipment (Net) 247,645 (120,238) 127,407 Change per the rate of sales growth Consistent with the recent trend, assume that PPE Turnover (Sales/Year-end PPE) will decrease by 0.2 each year Balance at the beginning of the year + Depreciation expenses for the year Deferred income taxes Goodwill Intangible assets not subject to amortization Intangible assets subject to amortization, gross Accumulated amortization-other intangible assets Intangible assets subject to amortization, net Other long-term assets Total Assets: 3,870 407,587 301,148 163,786 (14,079) 149,707 6,842 1,289,470 The proportion of deferred income taxes to income tax expenses will remain the same as in 2011 No change; the same number each year as in 2011 Change per the rate of sales growth Change per the rate of sales growth Balance at the beginning of the year + Amortization expenses for the year S Change per the rate of sales growth $ $ $ No change; the same number each year as in 2011 Change per the rate of sales growth Change per the rate of sales growth Liabilities and Stockholders Equity Current Liabilities: Current portion of long-term debt Accounts payable and accrued liabilities Payable to growers Total Current Liabilities Long-term obligations Deferred income taxes Other liabilities Stockholders Equity | Common stock, $0.001 par value 41,700 128,874 15,186 185,760 490,001 131,870 25,969 $ Balance at the beginning of the year +New debt issued - Repayments of debt Change per the rate of sales growth Change per the rate of sales growth $ $ 22 Treasury stock, at cost (6,867) No change; the same number each year as in 2011 For 2012-2016, treasury stock will be increased by the amount purchased each year (provided in the Statement of Cash Flows). For 2017, total treasury stock purchased should be total stockholders' equity minus all other components of stockholders' equity 2011 footnote mentions that APIC increased by $1,803. Assume the same increase! for each year. No change; the same number each year as in 2011 Additional paid-in capital (APIC) Accumulated other comprehensive gain/loss) | Retained Earnings 318,083 18,500 125,057 For 2012-2016, total of all components of stockholders' equity. For 2017, increase total stockholders' equity by the rate of sales growth (terminal growth assumption) | Total Stockholders Equity Total Liabilities and Stockholders' Equity 461,640 --- 1,288,373