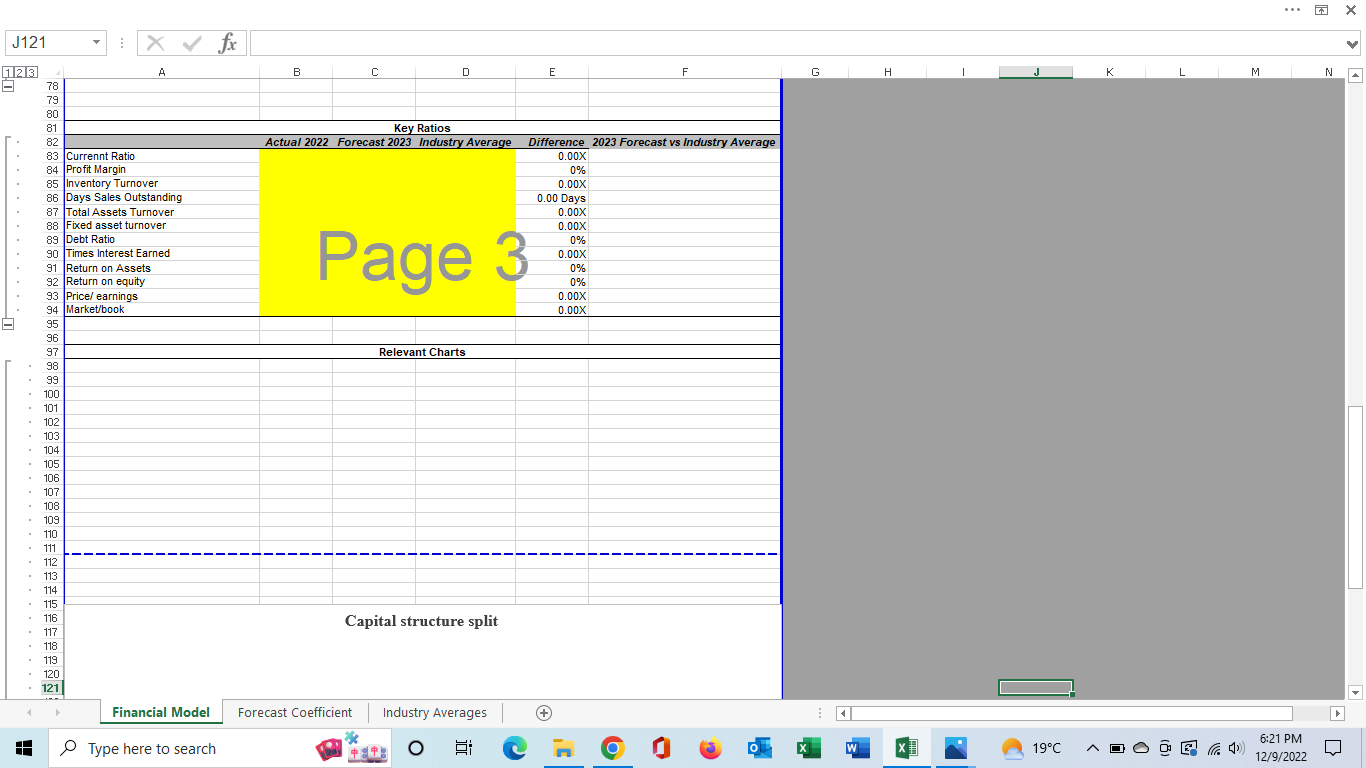
. . . j X J1 X Vfx 12 3 A B C D E F G H K L M N Sabex (Pty) Ltd
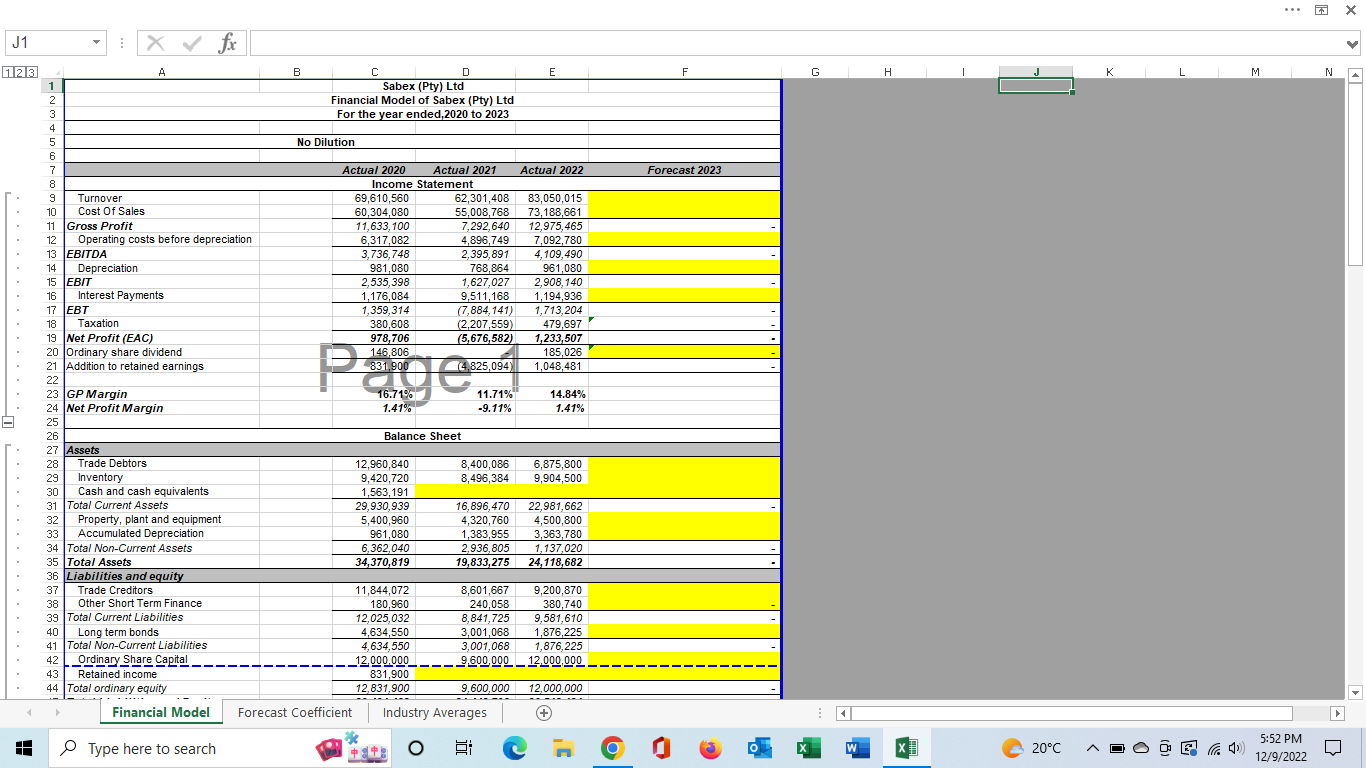
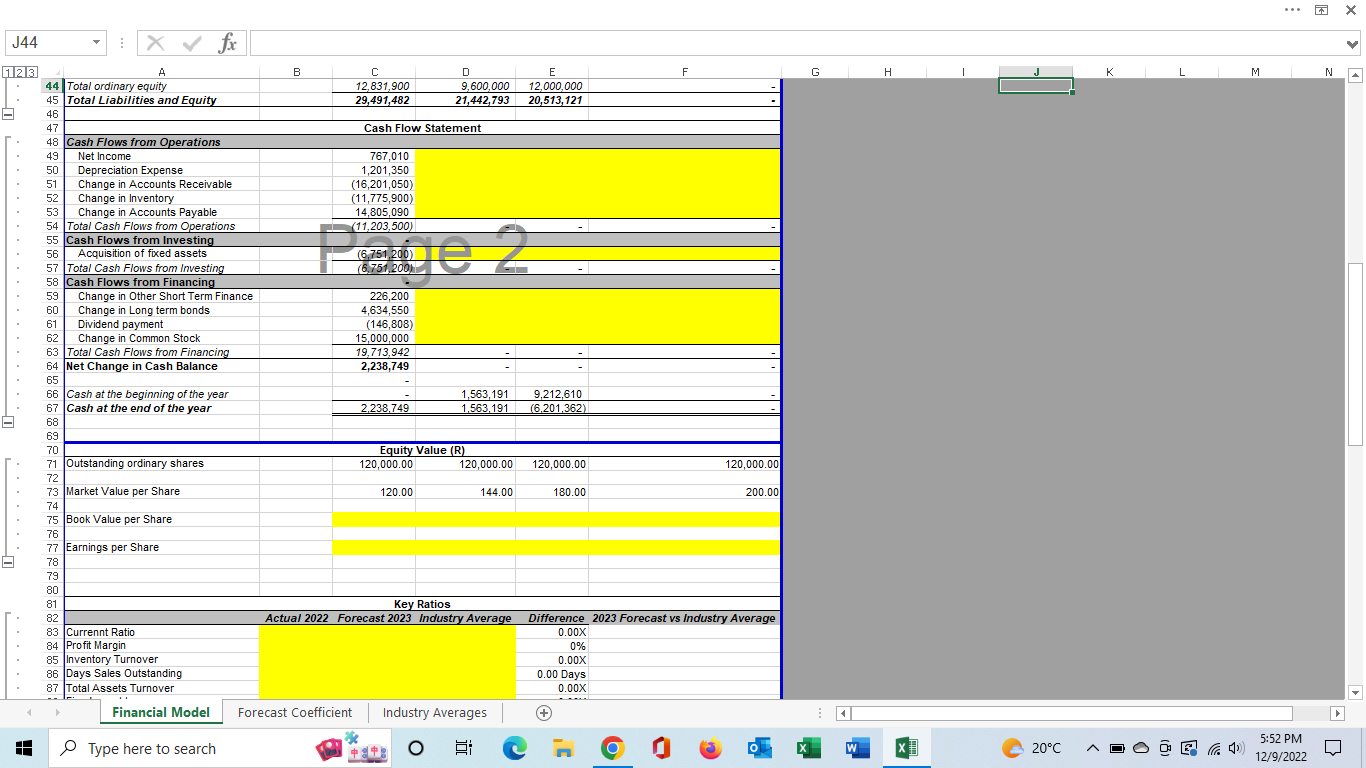
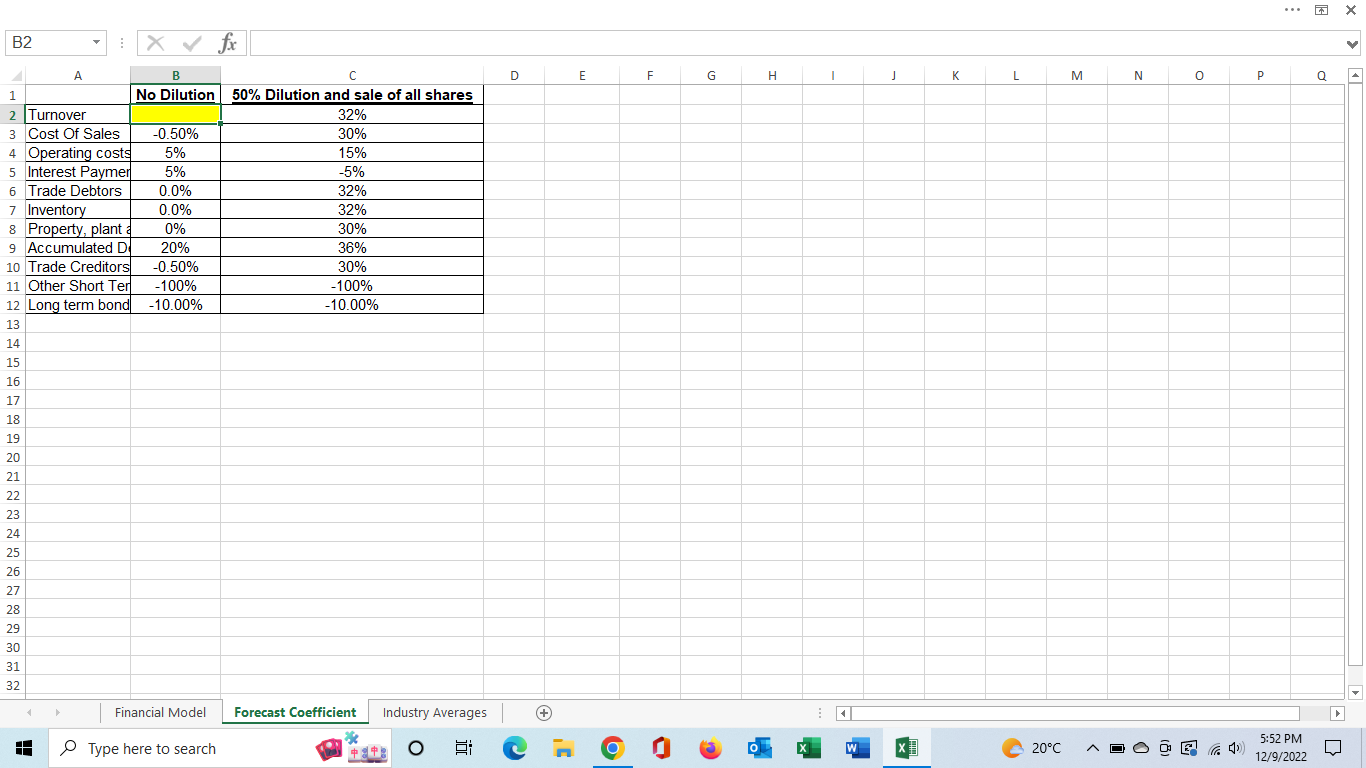
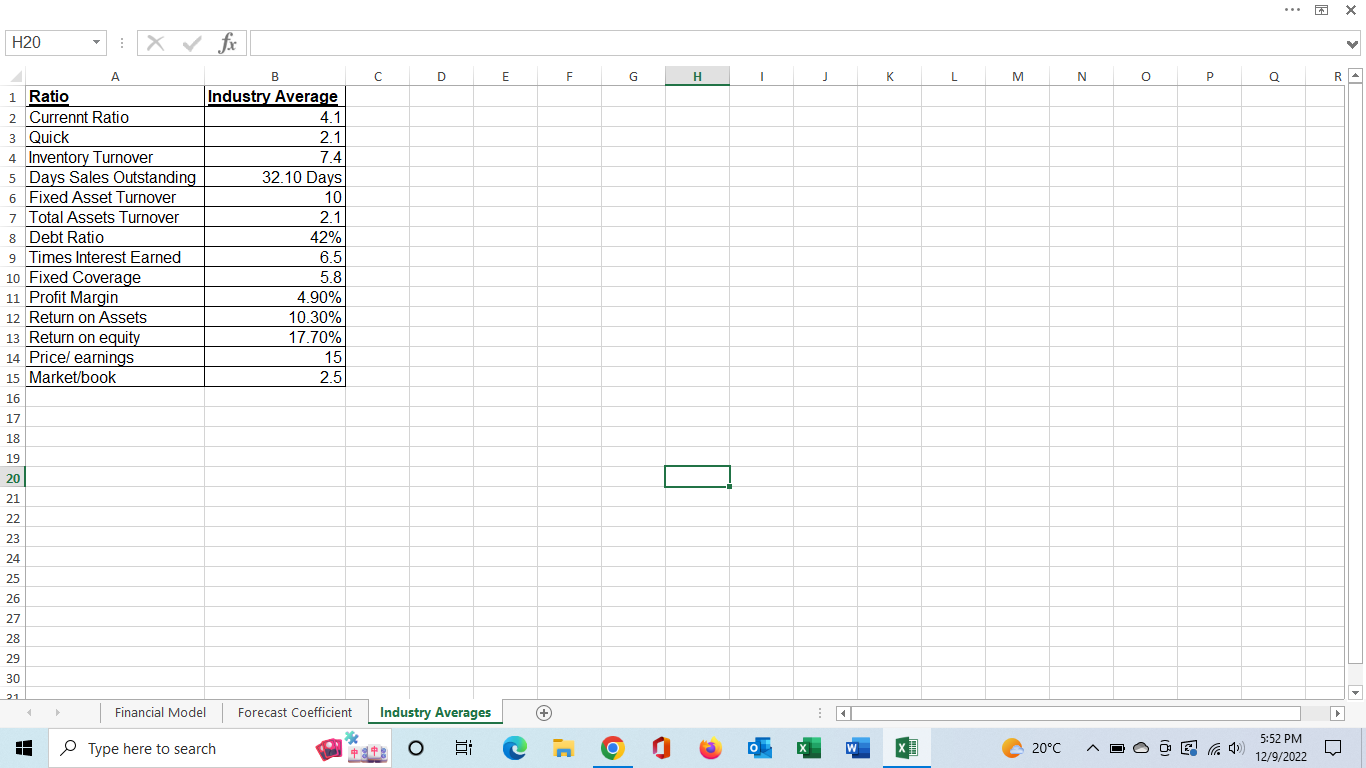
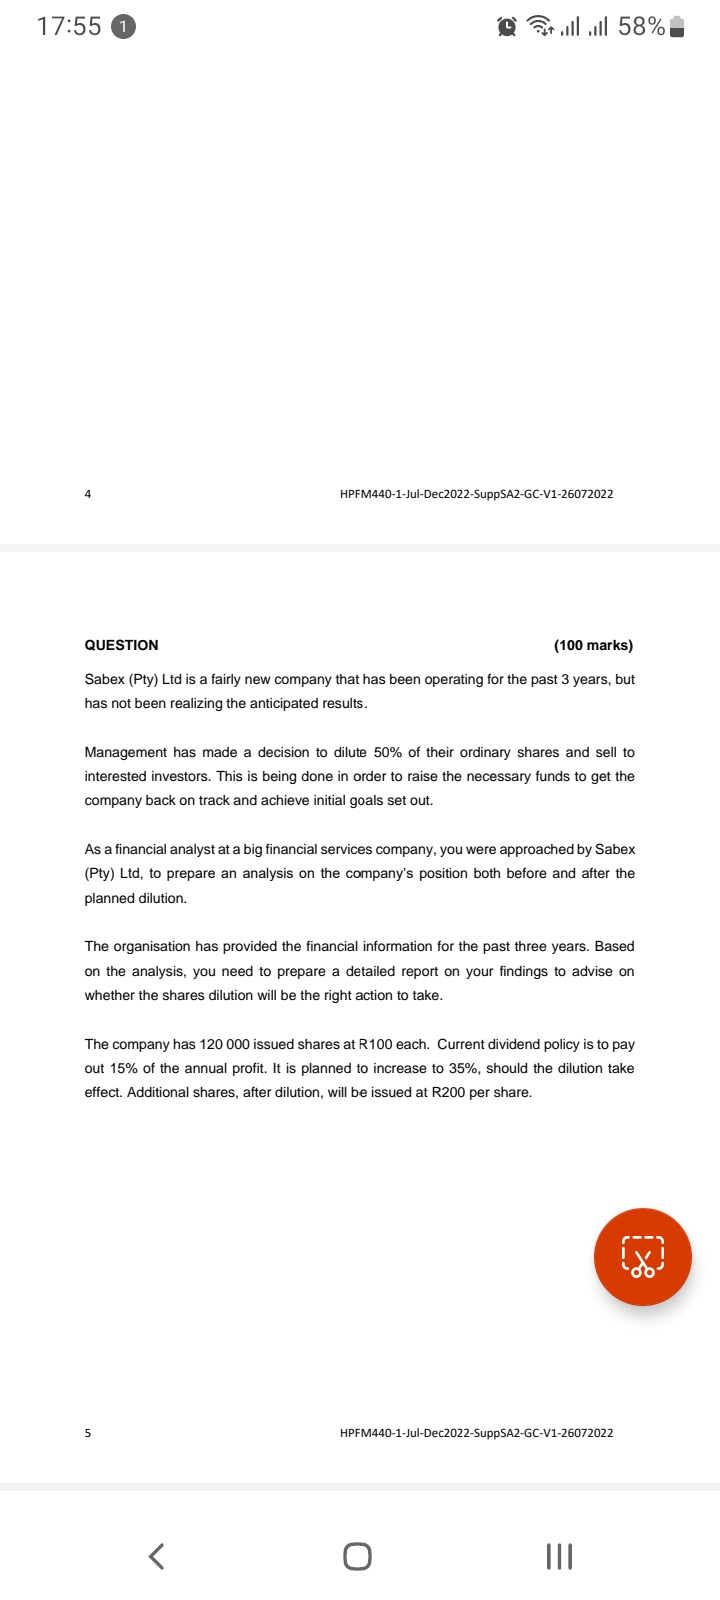
. . . j X J1 X Vfx 12 3 A B C D E F G H K L M N Sabex (Pty) Ltd Financial Model of Sabex (Pty) Ltd For the year ended,2020 to 2023 No Dilution Actual 2020 Actual 2021 Actual 2022 Forecast 2023 Income Statement Turnover 69,610,560 62,301,408 83,050,015 Cost Of Sale 60,304,080 55,008,768 73,188,661 Gross Profit 11,633, 100 7,292,640 12,975,465 Operating costs before depreciation 6,317,082 4,896,749 7,092,780 EBITDA 3,736,748 2,395, 891 , 109, 490 Depreciation 981,080 768,864 961,080 EBIT 2,535,398 1,627,027 2,908, 140 Interest Payments 1,176,084 9,511,168 1,194,936 EBT 1,359,314 (7,884, 141) 1,713,204 Taxation 380,608 2,207,559 479,697 Net Profit (EAC) 978,706 (5,676,582 1,233,507 :0 Ordinary share dividend 146,806 185,026 Addition to retained earnings 4 825,094) 1,048,481 GP Margin 16.71% 11.71% 14.84% 24 Net Profit Margin 1.41% -9.11% 1.41% Balance Sheet 27 Assets Trade Debtors 12,960,840 8,400,086 6,875,800 Inventory 9,420,720 8,496,384 9,904,500 Cash and cash equivalents 1,563,191 Total Current Assets 29,930,939 16,896, 470 22,981, 662 Property, plant and equipment 5,400,960 4,320,760 4,500,800 Accumulated Depreciation 961,080 1,383,955 3,363,780 Total Non-Current Assets 6,362,040 2,936,805 1,137,020 15 Total Assets 34,370,819 19,833,275 24, 118,682 Liabilities and equity Trade Creditors 11,844,072 8,601,667 9,200,870 Other Short Term Finance 180,960 240,058 380,740 Total Current Liabilities 12,025,032 8,841,725 9,581,610 40 Long term bonds 4,634,550 3,001,068 1,876,225 41 Total Non-Current Liabilities 4,634,550 8,001,068 1,876,225 42 _ _Ordinary Share Capital 12,000.000 9.600,000 _12,000,000 43 Retained income 831,900 44 Total ordinary equity 12, 831,900 9, 600,000 12,000,000 Financial Model Forecast Coefficient Industry Averages + D Type here to search O X W C 20 ' C A DO DE() 5:52 PM 12/9/2022. . . j X J44 X V fx 123 A B C D E F G H K L M N 44 Total ordinary equity 12,831,900 9,600,000 12,000,000 45 Total Liabilities and Equity 29,491,482 21,442,793 20,513,121 46 47 Cash Flow Statement 48 Cash Flows from Operations Net Income 767,010 Depreciation Expense 1,201,350 Change in Accounts Receivable (16,201,050) Change in Inventory (11,775,900) Change in Accounts Payable 14,805,090 Total Cash Flows from Operations (11,203,500) Cash Flows from Investing Acquisition of fixed assets 7 Total Cash Flows from Investing (6,751 200) 6.751 200 8 Cash Flows from Financing Change in Other Short Term Finance 226,200 Change in Long term bonds 4,634,550 Dividend payment (146,808) Change in Common Stock 15,000,000 Total Cash Flows from Financing 19,713,942 4 Net Change in Cash Balance 2,238,749 BOBBd20838 88388288988848-8348 Cash at the beginning of the year 1,563,191 9,212,610 7 Cash at the end of the year 2.238,749 1,563,191 (6,201,362 Equity Value (R) Outstanding ordinary shares 120,000.00 120,000.00 120,000.00 120,000.00 Market Value per Share 120.00 144.00 180.00 200.00 Book Value per Share Earnings per Share 80 Key Ratios 82 Actual 2022 Forecast 2023 Industry Average Difference 2023 Forecast vs Industry Average 83 Currennt Ratio 0.00X Profit Margin 0% 85 Inventory Turnover 0.00X 6 Days Sales Outstanding 0.00 Days 87 Total Assets Turnover 0.00X Financial Model Forecast Coefficient Industry Averages + D Type here to search O Si X W C 20 ' C A DO DE() 5:52 PM 12/9/2022. . . X B2 X V fx A B C D E F G H I J K L M N 0 P Q No Dilution 50% Dilution and sale of all shares 2 Turnover 32% 3 Cost Of Sales -0.50% 30% 4 Operating costs 5% 15% Interest Paymer 5% 5% 6 Trade Debtors 0.0% 32% 7 Inventory 0.0% 32% 8 Property, plant 30% 9 Accumulated D 20% 36% 10 Trade Creditors -0.50% 30% 11 Other Short Ter -100% -100% 12 Long term bond -10.00% -10.00% 13 14 15 16 17 18 19 20 21 22 23 24 25 26 27 28 29 30 31 32 Financial Model Forecast Coefficient Industry Averages + D Type here to search O X W C 20 ' C A DO DE() 5:52 PM 12/9/2022. . . X H20 Y X V fx A B C D E F G H I J K L M N O P Q R 1 Ratio Industry Average 2 Currennt Ratio 4.1 3 Quick 2.1 Inventory Turnover 7.4 5 Days Sales Outstanding 32.10 Days 6 Fixed Asset Turnover 10 7 Total Assets Turnover 2.1 8 Debt Ratio 42% 9 Times Interest Earned 6.5 10 Fixed Coverage 5.8 11 Profit Margin 4.90% 12 Return on Assets 10.30% 13 Return on equity 17.70% 14 Price/ earnings 15 15 Market book 2.5 16 17 18 19 20 21 22 23 24 25 26 27 28 29 30 21 Financial Model Forecast Coefficient Industry Averages + D Type here to search O X W 5:52 PM 12/9/2022. . . j X J121 X Vfx 12 3 A B C D E F G H K L M N Key Ratios Actual 2022 Forecast 2023 Industry Average Difference 2023 Forecast vs Industry Average 28 89 Currennt Ratio 0.00X 34 Profit Margin 0% Inventory Turnover 0.00X Days Sales Outstanding 0.00 Days 17 Total Assets Turnover 0.00X is Fixed asset turnover 0.00X Debt Ratio Page 3 0% Times Interest Earned 0.00X 91 Return on Assets 0% 2 Return on equity 0% 93 Price/ earnings 0.00X 94 Market/book 0.00X 96 Relevant Charts 101 102 103 104 105 106 107 108 109 110 111 712 113 114 115 116 Capital structure split 117 118 119 120 121 Financial Model Forecast Coefficient Industry Averages + D 6:21 PM Type here to search O Si X W X 19 0 ^ DO DE(1) 12/9/202217155 0 '9' ght\" all 58%- 4 HPFMm-l-Jul-DerZDZZSUDDSAZ-GC-Vl-26072022 QUESTION (100 marks) Sapex {Pty} Ltd is a fairly new company that has been operating for the past 3 years, but has not been realizing the anticipated results. Management has made a decision to dilute 50% of their ordinary shares and sell to interested investors. This is being done in order to raise the necessary funds to get the company back on track and achieve initial goals set out. As a financial analyst at a big financial services company, you were approached by Sabex (Pty) Ltd, to prepare an analysis on the company's position both before and after the planned dilution. The organisation has provided the financial information for the past three years. Based on the analysis, you need to prepare a detailed report on your findings to advise on whether the shares dilution will be the right action to take. The company has 120 000 issued shares at R100 each. Current dividend policy is to pay out 15% of the annual profit. It is planned to increase to 35%. should the dilution take effect. Additional shares, after dilution, will be issued at R200 per share. 5 HPFMm-l-Jul-DerZDZZSUDDSAZ-GC-Vl-26072022
Step by Step Solution
There are 3 Steps involved in it
Step: 1
Get Instant Access to Expert-Tailored Solutions
See step-by-step solutions with expert insights and AI powered tools for academic success
Step: 2
Step: 3
Ace Your Homework with AI
Get the answers you need in no time with our AI-driven, step-by-step assistance