

Question
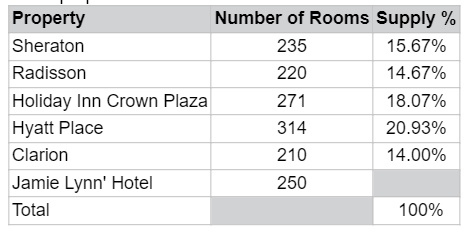
.Jamie Lynn is the revenue manager at a 250room fullservice hotel property. Her comp set includes five full and limitedservice properties: The demand and revenue
.Jamie Lynn is the revenue manager at a 250room fullservice hotel property. Her comp set includes five full and limitedservice properties:
The demand and revenue performance of Jamie Lynn's hotel for the time period of January through May are listed below.
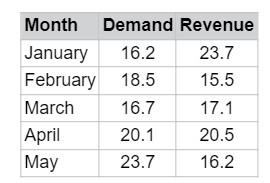
Assume there were no changes in the number of rooms offered by the comp set or by Jayme Lynn, during the period January to May.
What was Jayme Lynn's proportion of the comp set's supply? Jamie Lynn supply : Comp set supply = 50/1250 =20%
In which months did Jamie Lynn's occupancy rate exceed that of her comp set? _________
In which months did Jamie Lynn's ADR exceed that of her comp set? _________
Based on Jamie Lynn's January results, what room raterelated advice would you give her?
Based on Jamie Lynn's May results, what room raterelated advice would you give her?
\begin{tabular}{|l|c|c|} \hline Property & Number of Rooms Supply \% \\ \hline Sheraton & 235 & 15.67% \\ \hline Radisson & 220 & 14.67% \\ \hline Holiday Inn Crown Plaza & 271 & 18.07% \\ \hline Hyatt Place & 314 & 20.93% \\ \hline Clarion & 210 & 14.00% \\ \hline Jamie Lynn' Hotel & 250 & \\ \hline Total & & 100% \\ \hline \end{tabular} \begin{tabular}{|l|c|c|} \hline Month & \multicolumn{2}{|c|}{ Demand Revenue } \\ \hline January & 16.2 & 23.7 \\ \hline February & 18.5 & 15.5 \\ \hline March & 16.7 & 17.1 \\ \hline April & 20.1 & 20.5 \\ \hline May & 23.7 & 16.2 \\ \hline \end{tabular} \begin{tabular}{|l|c|c|} \hline Property & Number of Rooms Supply \% \\ \hline Sheraton & 235 & 15.67% \\ \hline Radisson & 220 & 14.67% \\ \hline Holiday Inn Crown Plaza & 271 & 18.07% \\ \hline Hyatt Place & 314 & 20.93% \\ \hline Clarion & 210 & 14.00% \\ \hline Jamie Lynn' Hotel & 250 & \\ \hline Total & & 100% \\ \hline \end{tabular} \begin{tabular}{|l|c|c|} \hline Month & \multicolumn{2}{|c|}{ Demand Revenue } \\ \hline January & 16.2 & 23.7 \\ \hline February & 18.5 & 15.5 \\ \hline March & 16.7 & 17.1 \\ \hline April & 20.1 & 20.5 \\ \hline May & 23.7 & 16.2 \\ \hline \end{tabular}Step by Step Solution
There are 3 Steps involved in it
Step: 1

Get Instant Access to Expert-Tailored Solutions
See step-by-step solutions with expert insights and AI powered tools for academic success
Step: 2

Step: 3
Ace Your Homework with AI
Get the answers you need in no time with our AI-driven, step-by-step assistance
Get Started
Impact Investing Instruments Mechanisms And Actors
Authors: Wolfgang Spiess-Knafl Barbara Scheck
1st Edition
3319665553,3319665561