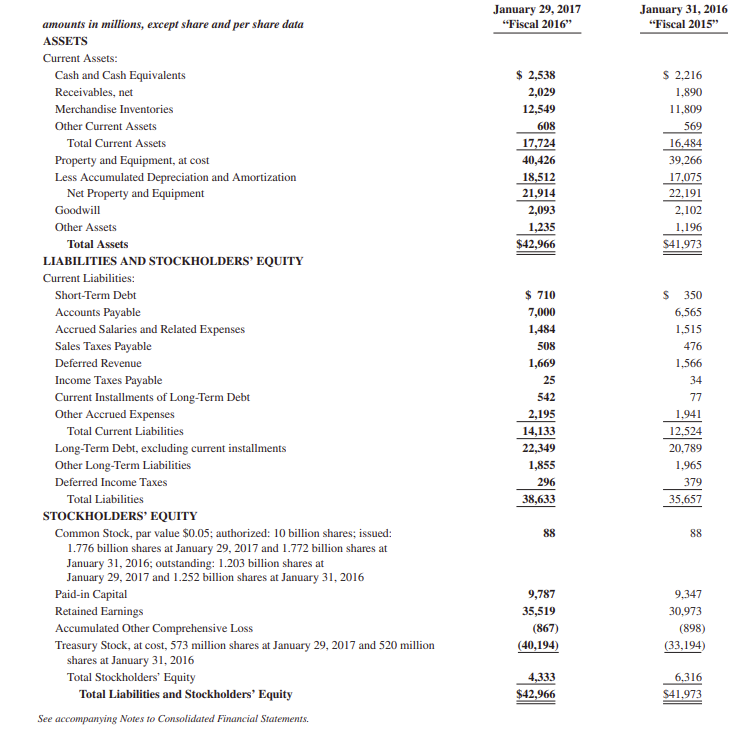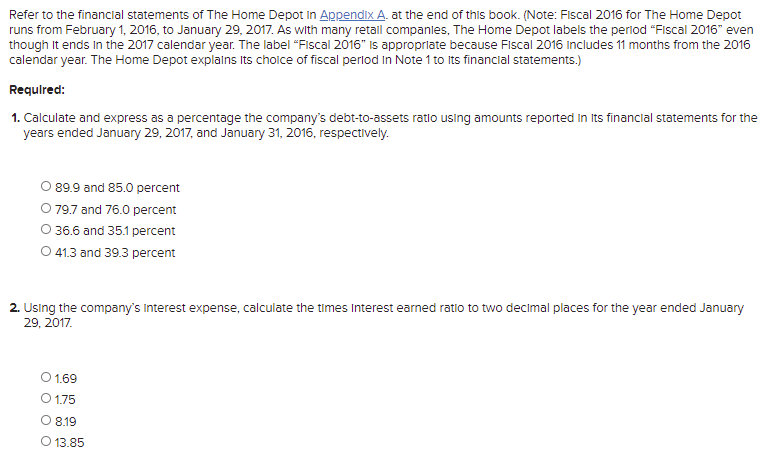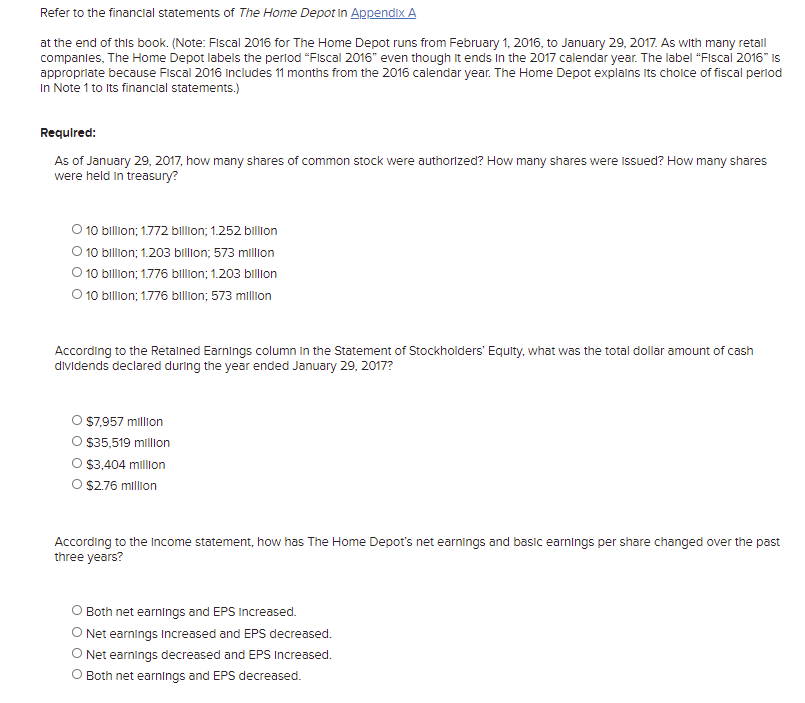


January 29, 2017 "Fiscal 2016" January 31, 2016 "Fiscal 2015" $ 2,538 2,029 12,549 608 17,724 40,426 18,512 21,914 2,093 1,235 $42,966 $ 2,216 1.890 11.809 569 16,484 39.266 17.075 22,191 2,102 1.196 $41.973 $ 710 amounts in millions, except share and per share data ASSETS Current Assets: Cash and Cash Equivalents Receivables, net Merchandise Inventories Other Current Assets Total Current Assets Property and Equipment, at cost Less Accumulated Depreciation and Amortization Net Property and Equipment Goodwill Other Assets Total Assets LIABILITIES AND STOCKHOLDERS' EQUITY Current Liabilities: Short-Term Debt Accounts Payable Accrued Salaries and Related Expenses Sales Taxes Payable Deferred Revenue Income Taxes Payable Current Installments of Long-Term Debt Other Accrued Expenses Total Current Liabilities Long-Term Debt, excluding current installments Other Long-Term Liabilities Deferred Income Taxes Total Liabilities STOCKHOLDERS' EQUITY Common Stock, par value $0.05; authorized: 10 billion shares; issued: 1.776 billion shares at January 29, 2017 and 1.772 billion shares at January 31, 2016; outstanding: 1.203 billion shares at January 29, 2017 and 1.252 billion shares at January 31, 2016 Paid-in Capital Retained Earnings Accumulated Other Comprehensive Loss Treasury Stock, at cost, 573 million shares at January 29, 2017 and 520 million shares at January 31, 2016 Total Stockholders' Equity Total Liabilities and Stockholders' Equity See accompanying Notes to Consolidated Financial Statements. 7,000 1,484 508 1,669 25 542 2,195 14,133 22,349 1,855 296 38,633 $ 350 6,565 1.515 476 1.566 34 77 1.941 12.524 20.789 1.965 379 35,657 88 88 9,787 35,519 (867) (40,194) 9.347 30.973 (898) (33,194) 4,333 $42,966 6.316 $41.973 Refer to the financial statements of The Home Depot in Appendix A. at the end of this book. (Note: Fiscal 2016 for The Home Depot runs from February 1, 2016, to January 29, 2017. As with many retail companies, The Home Depot labels the period "Fiscal 2016" even though it ends in the 2017 calendar year. The label "Fiscal 2016" is appropriate because Fiscal 2016 Includes 11 months from the 2016 calendar year. The Home Depot explains its choice of fiscal period in Note 1 to its financial statements.) Required: 1. Calculate and express as a percentage the company's debt-to-assets ratio using amounts reported in its financial statements for the years ended January 29, 2017, and January 31, 2016, respectively. 89.9 and 85.0 percent 79.7 and 76.0 percent 36.6 and 35.1 percent O 41.3 and 39.3 percent 2. Using the company's Interest expense, calculate the times Interest earned ratio to two decimal places for the year ended January 29, 2017 O 1.69 1.75 O 8.19 O 13.85 Refer to the financial statements of The Home Depot In Appendix A at the end of this book. (Note: Fiscal 2016 for The Home Depot runs from February 1, 2016, to January 29, 2017. As with many retail companles, The Home Depot labels the period "Fiscal 2016" even though it ends in the 2017 calendar year. The label "Fiscal 2016" is appropriate because Fiscal 2016 Includes 11 months from the 2016 calendar year. The Home Depot explains Its choice of fiscal period In Note 1 to its financial statements.) Required: As of January 29, 2017, how many shares of common stock were authorized? How many shares were issued? How many shares were held in treasury? 10 billion; 1.772 billion; 1.252 billion O 10 billion; 1.203 billion; 573 million O 10 billion; 1.776 billion; 1.203 billion 10 billion; 1776 billion; 573 million According to the Retained Earnings column in the Statement of Stockholders' Equity, what was the total dollar amount of cash dividends declared during the year ended January 29, 2017? O $7,957 million $35,519 million O $3,404 million O $2.76 million According to the income statement, how has The Home Depot's net earnings and basic earnings per share changed over the past three years? O Both net earnings and EPS increased. Net earnings Increased and EPS decreased. O Net earnings decreased and EPS Increased. O Both net earnings and EPS decreased. January 29, 2017 "Fiscal 2016" January 31, 2016 "Fiscal 2015" $ 2,538 2,029 12,549 608 17,724 40,426 18,512 21,914 2,093 1,235 $42,966 $ 2,216 1.890 11.809 569 16,484 39.266 17.075 22,191 2,102 1.196 $41.973 $ 710 amounts in millions, except share and per share data ASSETS Current Assets: Cash and Cash Equivalents Receivables, net Merchandise Inventories Other Current Assets Total Current Assets Property and Equipment, at cost Less Accumulated Depreciation and Amortization Net Property and Equipment Goodwill Other Assets Total Assets LIABILITIES AND STOCKHOLDERS' EQUITY Current Liabilities: Short-Term Debt Accounts Payable Accrued Salaries and Related Expenses Sales Taxes Payable Deferred Revenue Income Taxes Payable Current Installments of Long-Term Debt Other Accrued Expenses Total Current Liabilities Long-Term Debt, excluding current installments Other Long-Term Liabilities Deferred Income Taxes Total Liabilities STOCKHOLDERS' EQUITY Common Stock, par value $0.05; authorized: 10 billion shares; issued: 1.776 billion shares at January 29, 2017 and 1.772 billion shares at January 31, 2016; outstanding: 1.203 billion shares at January 29, 2017 and 1.252 billion shares at January 31, 2016 Paid-in Capital Retained Earnings Accumulated Other Comprehensive Loss Treasury Stock, at cost, 573 million shares at January 29, 2017 and 520 million shares at January 31, 2016 Total Stockholders' Equity Total Liabilities and Stockholders' Equity See accompanying Notes to Consolidated Financial Statements. 7,000 1,484 508 1,669 25 542 2,195 14,133 22,349 1,855 296 38,633 $ 350 6,565 1.515 476 1.566 34 77 1.941 12.524 20.789 1.965 379 35,657 88 88 9,787 35,519 (867) (40,194) 9.347 30.973 (898) (33,194) 4,333 $42,966 6.316 $41.973 Refer to the financial statements of The Home Depot in Appendix A. at the end of this book. (Note: Fiscal 2016 for The Home Depot runs from February 1, 2016, to January 29, 2017. As with many retail companies, The Home Depot labels the period "Fiscal 2016" even though it ends in the 2017 calendar year. The label "Fiscal 2016" is appropriate because Fiscal 2016 Includes 11 months from the 2016 calendar year. The Home Depot explains its choice of fiscal period in Note 1 to its financial statements.) Required: 1. Calculate and express as a percentage the company's debt-to-assets ratio using amounts reported in its financial statements for the years ended January 29, 2017, and January 31, 2016, respectively. 89.9 and 85.0 percent 79.7 and 76.0 percent 36.6 and 35.1 percent O 41.3 and 39.3 percent 2. Using the company's Interest expense, calculate the times Interest earned ratio to two decimal places for the year ended January 29, 2017 O 1.69 1.75 O 8.19 O 13.85 Refer to the financial statements of The Home Depot In Appendix A at the end of this book. (Note: Fiscal 2016 for The Home Depot runs from February 1, 2016, to January 29, 2017. As with many retail companles, The Home Depot labels the period "Fiscal 2016" even though it ends in the 2017 calendar year. The label "Fiscal 2016" is appropriate because Fiscal 2016 Includes 11 months from the 2016 calendar year. The Home Depot explains Its choice of fiscal period In Note 1 to its financial statements.) Required: As of January 29, 2017, how many shares of common stock were authorized? How many shares were issued? How many shares were held in treasury? 10 billion; 1.772 billion; 1.252 billion O 10 billion; 1.203 billion; 573 million O 10 billion; 1.776 billion; 1.203 billion 10 billion; 1776 billion; 573 million According to the Retained Earnings column in the Statement of Stockholders' Equity, what was the total dollar amount of cash dividends declared during the year ended January 29, 2017? O $7,957 million $35,519 million O $3,404 million O $2.76 million According to the income statement, how has The Home Depot's net earnings and basic earnings per share changed over the past three years? O Both net earnings and EPS increased. Net earnings Increased and EPS decreased. O Net earnings decreased and EPS Increased. O Both net earnings and EPS decreased


