

Question: Java 1. The data file. The first part of your assignment is to select a subject for a data file, which will be a simple
Java
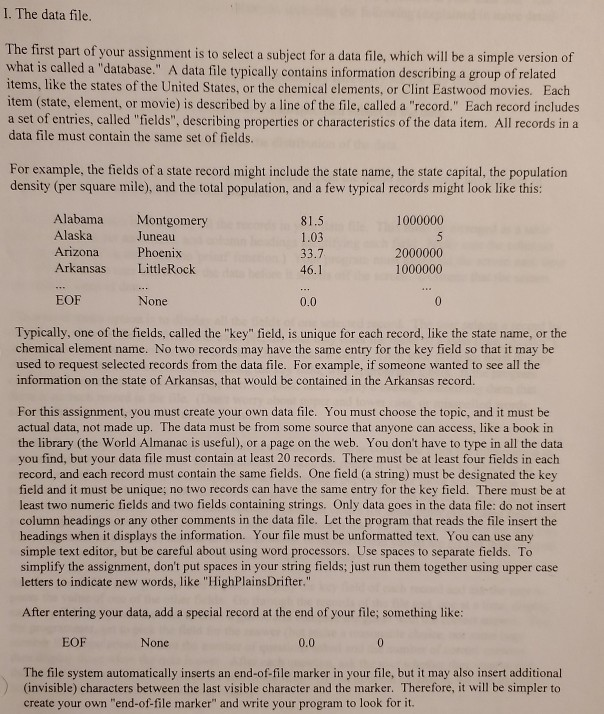
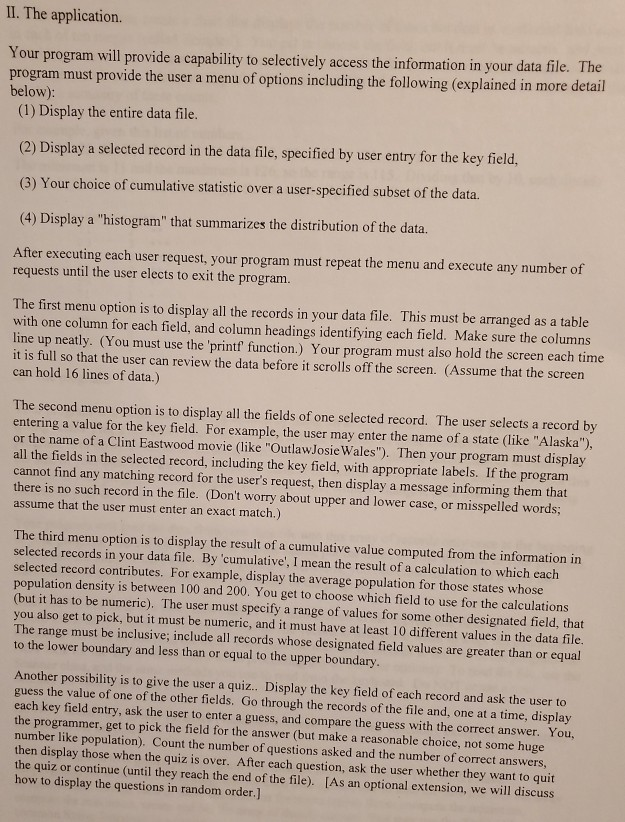
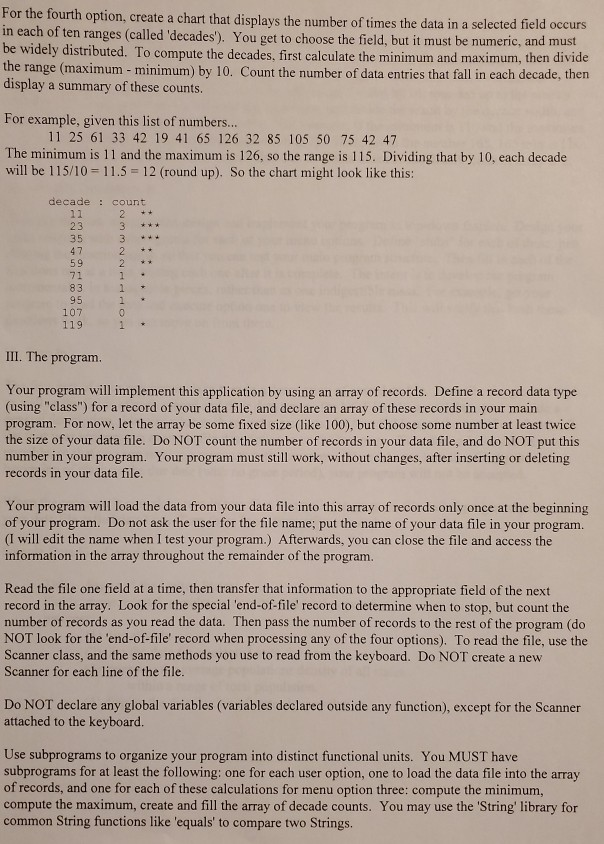
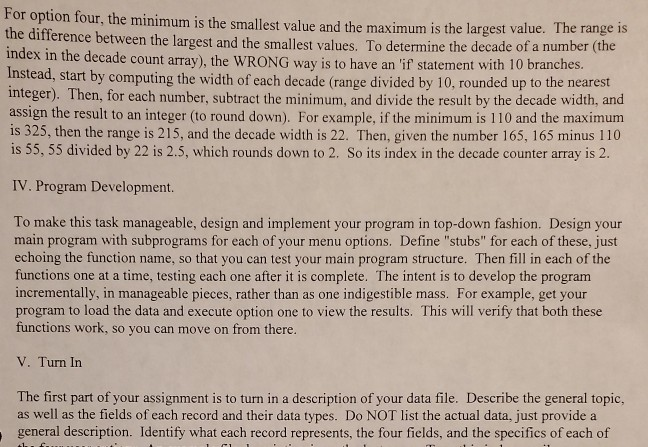
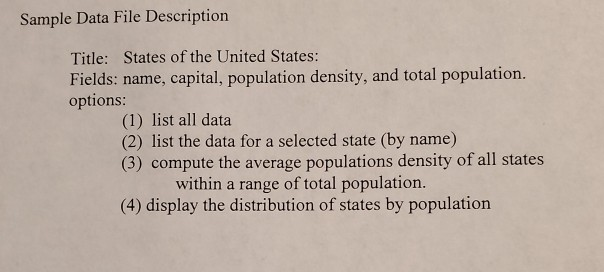
1. The data file. The first part of your assignment is to select a subject for a data file, which will be a simple version of what is called a "database." A data file typically contains information describing a group of related items, like the states of the United States, or the chemical elements, or Clint Eastwood movies. Each item (state, element, or movie) is described by a line of the file, called a "record." Each record includes a set of entries, called "fields", describing properties or characteristics of the data item. All records in a data file must contain the same set of fields. For example, the fields of a state record might include the state name, the state capital, the population density (per square mile), and the total population, and a few typical records might look like this: 1000000 Alabama Alaska Arizona Arkansas Montgomery Juneau Phoenix Little Rock 81.5 1.03 33.7 46.1 2000000 1000000 EOF None 0.0 0 Typically, one of the fields, called the "key" field, is unique for each record, like the state name, or the chemical element name. No two records may have the same entry for the key field so that it may be used to request selected records from the data file. For example, if someone wanted to see all the information on the state of Arkansas, that would be contained in the Arkansas record. For this assignment, you must create your own data file. You must choose the topic, and it must be 9. The data must be from some source that anyone can access, like a book in the library (the World Almanac is useful), or a page on the web. You don't have to type in all the data you find, but your data file must contain at least 20 records. There must be at least four fields in each record, and each record must contain the same fields. One field (a string) must be designated the key field and it must be unique, no two records can have the same entry for the key field. There must be at least two numeric fields and two fields containing strings. Only data goes in the data file: do not insert column headings or any other comments in the data file. Let the program that reads the file insert the headings when it displays the information. Your file must be unformatted text. You can use any simple text editor, but be careful about using word processors. Use spaces to separate fields. To simplify the assignment, don't put spaces in your string fields, just run them together using upper case letters to indicate new words, like "High Plains Drifter." After entering your data, add a special record at the end of your file, something like: EOF None 0.0 The file system automatically inserts an end-of-file marker in your file, but it may also insert additional (invisible) characters between the last visible character and the marker. Therefore, it will be simpler to create your own "end-of-file marker" and write your program to look for it. The application. our program will provide a capability to selectively access the information in your data file. The mrogram must provide the user a menu of options including the following (explained in more detail below): (1) Display the entire data file. (2) Display a selected record in the data file, specified by user entry for the key field, (3) Your choice of cumulative statistic over a user-specified subset of the data. (4) Display a "histogram" that summarizes the distribution of the data. After executing each user request, your program must repeat the menu and execute any number of requests until the user elects to exit the program. The first menu option is to display all the records in your data file. This must be arranged as a table with one column for each field, and column headings identifying each field. Make sure the columns line up neatly. (You must use the printf' function.) Your program must also hold the screen each time it is full so that the user can review the data before it scrolls off the screen. (Assume that the screen can hold 16 lines of data.) The second menu option is to display all the fields of one selected record. The user selects a record by entering a value for the key field. For example, the user may enter the name of a state (like "Alaska"). or the name of a Clint Eastwood movie (like "OutlawJosie Wales"). Then your program must display all the fields in the selected record, including the key field, with appropriate labels. If the program cannot find any matching record for the user's request, then display a message informing them that there is no such record in the file. (Don't worry about upper and lower case, or misspelled words; assume that the user must enter an exact match.) The third menu option is to display the result of a cumulative value computed from the information in selected records in your data file. By 'cumulative', I mean the result of a calculation to which each selected record contributes. For example, display the average population for those states whose population density is between 100 and 200. You get to choose which field to use for the calculations heric). The user must specify a range of values for some other designated field, that you also get to pick, but it must be numeric, and it must have at least 10 different values in the data file. The range must be inclusive; include all records whose designated field values are greater than or equal to the lower boundary and less than or equal to the upper boundary. Another possibility is to give the user a quiz.. Display the key field of each record and ask the user to guess the value of one of the other fields. Go through the records of the file and, one at a time, display each key field entry, ask the user to enter a guess, and compare the guess with the correct answer. You, the programmer, get to pick the field for the answer (but make a reasonable choice, not some huge number like population). Count the number of questions asked and the number of correct answers, then display those when the quiz is over. After each question, ask the user whether they want to quit the quiz or continue (until they reach the end of the file). [As an optional extension, we will discuss how to display the questions in random order.] For the fourth option, create a chart that displays the number of times the data in a selected field occurs in each of ten ranges (called 'decades'). You get to choose the field, but it must be numeric, and must be widely distributed. To compute the decades, first calculate the minimum and maximum, then divide the range (maximum - minimum) by 10. Count the number of data entries that fall in each decade, then display a summary of these counts. For example, given this list of numbers... 11 25 61 33 42 19 41 65 126 32 85 105 50 75 42 47 The minimum is 11 and the maximum is 126, so the range is 115. Dividing that by 10, each decade will be 115/10 - 11.5 - 12 (round up). So the chart might look like this: decade : count OWN owa III. The program Your program will implement this application by using an array of records. Define a record data type (using "class") for a record of your data file, and declare an array of these records in your main program. For now, let the array be some fixed size (like 100), but choose some number at least twice the size of your data file. Do NOT count the number of records in your data file, and do NOT put this number in your program. Your program must still work, without changes, after inserting or deleting records in your data file. Your program will load the data from your data file into this array of records only once at the beginning of your program. Do not ask the user for the file name; put the name of your data file in your program. (I will edit the name when I test your program.) Afterwards, you can close the file and access the information in the array throughout the remainder of the program. Read the file one field at a time, then transfer that information to the appropriate field of the next record in the array. Look for the special 'end-of-file' record to determine when to stop, but count the number of records as you read the data. Then pass the number of records to the rest of the program (do NOT look for the end-of-file' record when processing any of the four options). To read the file, use the Scanner class, and the same methods you use to read from the keyboard. Do NOT create a new Scanner for each line of the file. Do NOT declare any global variables (variables declared outside any function), except for the Scanner attached to the keyboard. Use subprograms to organize your program into distinct functional units. You MUST have subprograms for at least the following: one for each user option, one to load the data file into the array of records, and one for each of these calculations for menu option three: compute the minimum, compute the maximum, create and fill the array of decade counts. You may use the 'String' library for common String functions like 'equals' to compare two Strings. for option four, the minimum is the smallest value and the maximum is the largest value. The range is the difference between the largest and the smallest values. To determine the decade of a number (the index in the decade count array), the WRONG way is to have an 'if statement with 10 branches. Instead, start by computing the width of each decade (range divided by 10. rounded up to the nearest integer). Then, for each number, subtract the minimum, and divide the result by the decade width, and assign the result to an integer (to round down). For example, if the minimum is 110 and the maximum is 325, then the range is 215, and the decade width is 22. Then, given the number 165, 165 minus 110 is 55, 55 divided by 22 is 2.5, which rounds down to 2. So its index in the decade counter array is 2. IV. Program Development. To make this task manageable, design and implement your program in top-down fashion. Design your main program with subprograms for each of your menu options. Define "stubs" for each of these, just echoing the function name, so that you can test your main program structure. Then fill in each of the functions one at a time, testing each one after it is complete. The intent is to develop the program incrementally, in manageable pieces, rather than as one indigestible mass. For example, get your program to load the data and execute option one to view the results. This will verify that both these functions work, so you can move on from there. V. Turn In The first part of your assignment is to turn in a description of your data file. Describe the general topic, as well as the fields of each record and their data types. Do NOT list the actual data, just provide a general description. Identify what each record represents, the four fields, and the specifics of each of Sample Data File Description Title: States of the United States: Fields: name, capital, population density, and total population. options: (1) list all data (2) list the data for a selected state (by name) (3) compute the average populations density of all states within a range of total population. (4) display the distribution of states by population 1. The data file. The first part of your assignment is to select a subject for a data file, which will be a simple version of what is called a "database." A data file typically contains information describing a group of related items, like the states of the United States, or the chemical elements, or Clint Eastwood movies. Each item (state, element, or movie) is described by a line of the file, called a "record." Each record includes a set of entries, called "fields", describing properties or characteristics of the data item. All records in a data file must contain the same set of fields. For example, the fields of a state record might include the state name, the state capital, the population density (per square mile), and the total population, and a few typical records might look like this: 1000000 Alabama Alaska Arizona Arkansas Montgomery Juneau Phoenix Little Rock 81.5 1.03 33.7 46.1 2000000 1000000 EOF None 0.0 0 Typically, one of the fields, called the "key" field, is unique for each record, like the state name, or the chemical element name. No two records may have the same entry for the key field so that it may be used to request selected records from the data file. For example, if someone wanted to see all the information on the state of Arkansas, that would be contained in the Arkansas record. For this assignment, you must create your own data file. You must choose the topic, and it must be 9. The data must be from some source that anyone can access, like a book in the library (the World Almanac is useful), or a page on the web. You don't have to type in all the data you find, but your data file must contain at least 20 records. There must be at least four fields in each record, and each record must contain the same fields. One field (a string) must be designated the key field and it must be unique, no two records can have the same entry for the key field. There must be at least two numeric fields and two fields containing strings. Only data goes in the data file: do not insert column headings or any other comments in the data file. Let the program that reads the file insert the headings when it displays the information. Your file must be unformatted text. You can use any simple text editor, but be careful about using word processors. Use spaces to separate fields. To simplify the assignment, don't put spaces in your string fields, just run them together using upper case letters to indicate new words, like "High Plains Drifter." After entering your data, add a special record at the end of your file, something like: EOF None 0.0 The file system automatically inserts an end-of-file marker in your file, but it may also insert additional (invisible) characters between the last visible character and the marker. Therefore, it will be simpler to create your own "end-of-file marker" and write your program to look for it. The application. our program will provide a capability to selectively access the information in your data file. The mrogram must provide the user a menu of options including the following (explained in more detail below): (1) Display the entire data file. (2) Display a selected record in the data file, specified by user entry for the key field, (3) Your choice of cumulative statistic over a user-specified subset of the data. (4) Display a "histogram" that summarizes the distribution of the data. After executing each user request, your program must repeat the menu and execute any number of requests until the user elects to exit the program. The first menu option is to display all the records in your data file. This must be arranged as a table with one column for each field, and column headings identifying each field. Make sure the columns line up neatly. (You must use the printf' function.) Your program must also hold the screen each time it is full so that the user can review the data before it scrolls off the screen. (Assume that the screen can hold 16 lines of data.) The second menu option is to display all the fields of one selected record. The user selects a record by entering a value for the key field. For example, the user may enter the name of a state (like "Alaska"). or the name of a Clint Eastwood movie (like "OutlawJosie Wales"). Then your program must display all the fields in the selected record, including the key field, with appropriate labels. If the program cannot find any matching record for the user's request, then display a message informing them that there is no such record in the file. (Don't worry about upper and lower case, or misspelled words; assume that the user must enter an exact match.) The third menu option is to display the result of a cumulative value computed from the information in selected records in your data file. By 'cumulative', I mean the result of a calculation to which each selected record contributes. For example, display the average population for those states whose population density is between 100 and 200. You get to choose which field to use for the calculations heric). The user must specify a range of values for some other designated field, that you also get to pick, but it must be numeric, and it must have at least 10 different values in the data file. The range must be inclusive; include all records whose designated field values are greater than or equal to the lower boundary and less than or equal to the upper boundary. Another possibility is to give the user a quiz.. Display the key field of each record and ask the user to guess the value of one of the other fields. Go through the records of the file and, one at a time, display each key field entry, ask the user to enter a guess, and compare the guess with the correct answer. You, the programmer, get to pick the field for the answer (but make a reasonable choice, not some huge number like population). Count the number of questions asked and the number of correct answers, then display those when the quiz is over. After each question, ask the user whether they want to quit the quiz or continue (until they reach the end of the file). [As an optional extension, we will discuss how to display the questions in random order.] For the fourth option, create a chart that displays the number of times the data in a selected field occurs in each of ten ranges (called 'decades'). You get to choose the field, but it must be numeric, and must be widely distributed. To compute the decades, first calculate the minimum and maximum, then divide the range (maximum - minimum) by 10. Count the number of data entries that fall in each decade, then display a summary of these counts. For example, given this list of numbers... 11 25 61 33 42 19 41 65 126 32 85 105 50 75 42 47 The minimum is 11 and the maximum is 126, so the range is 115. Dividing that by 10, each decade will be 115/10 - 11.5 - 12 (round up). So the chart might look like this: decade : count OWN owa III. The program Your program will implement this application by using an array of records. Define a record data type (using "class") for a record of your data file, and declare an array of these records in your main program. For now, let the array be some fixed size (like 100), but choose some number at least twice the size of your data file. Do NOT count the number of records in your data file, and do NOT put this number in your program. Your program must still work, without changes, after inserting or deleting records in your data file. Your program will load the data from your data file into this array of records only once at the beginning of your program. Do not ask the user for the file name; put the name of your data file in your program. (I will edit the name when I test your program.) Afterwards, you can close the file and access the information in the array throughout the remainder of the program. Read the file one field at a time, then transfer that information to the appropriate field of the next record in the array. Look for the special 'end-of-file' record to determine when to stop, but count the number of records as you read the data. Then pass the number of records to the rest of the program (do NOT look for the end-of-file' record when processing any of the four options). To read the file, use the Scanner class, and the same methods you use to read from the keyboard. Do NOT create a new Scanner for each line of the file. Do NOT declare any global variables (variables declared outside any function), except for the Scanner attached to the keyboard. Use subprograms to organize your program into distinct functional units. You MUST have subprograms for at least the following: one for each user option, one to load the data file into the array of records, and one for each of these calculations for menu option three: compute the minimum, compute the maximum, create and fill the array of decade counts. You may use the 'String' library for common String functions like 'equals' to compare two Strings. for option four, the minimum is the smallest value and the maximum is the largest value. The range is the difference between the largest and the smallest values. To determine the decade of a number (the index in the decade count array), the WRONG way is to have an 'if statement with 10 branches. Instead, start by computing the width of each decade (range divided by 10. rounded up to the nearest integer). Then, for each number, subtract the minimum, and divide the result by the decade width, and assign the result to an integer (to round down). For example, if the minimum is 110 and the maximum is 325, then the range is 215, and the decade width is 22. Then, given the number 165, 165 minus 110 is 55, 55 divided by 22 is 2.5, which rounds down to 2. So its index in the decade counter array is 2. IV. Program Development. To make this task manageable, design and implement your program in top-down fashion. Design your main program with subprograms for each of your menu options. Define "stubs" for each of these, just echoing the function name, so that you can test your main program structure. Then fill in each of the functions one at a time, testing each one after it is complete. The intent is to develop the program incrementally, in manageable pieces, rather than as one indigestible mass. For example, get your program to load the data and execute option one to view the results. This will verify that both these functions work, so you can move on from there. V. Turn In The first part of your assignment is to turn in a description of your data file. Describe the general topic, as well as the fields of each record and their data types. Do NOT list the actual data, just provide a general description. Identify what each record represents, the four fields, and the specifics of each of Sample Data File Description Title: States of the United States: Fields: name, capital, population density, and total population. options: (1) list all data (2) list the data for a selected state (by name) (3) compute the average populations density of all states within a range of total population. (4) display the distribution of states by population
Step by Step Solution
There are 3 Steps involved in it

Get step-by-step solutions from verified subject matter experts