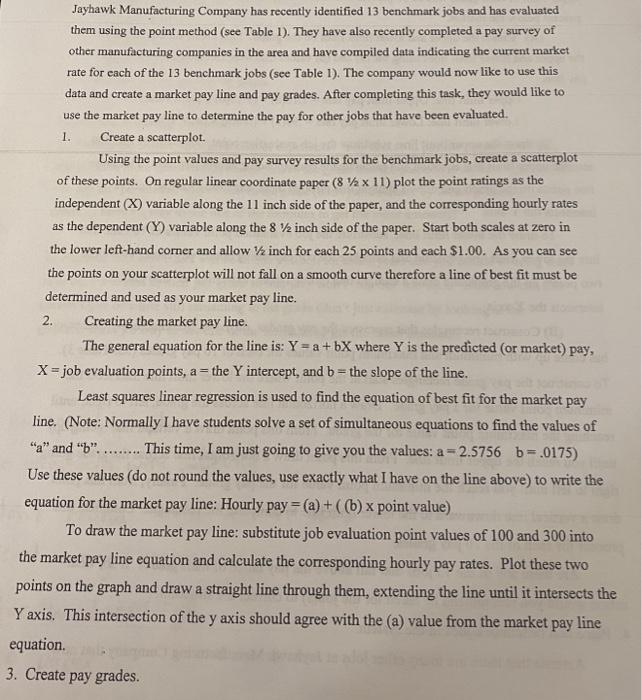
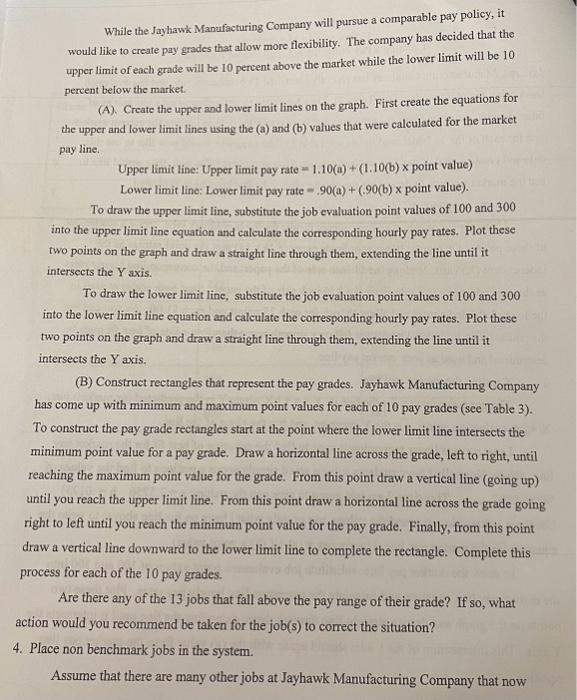
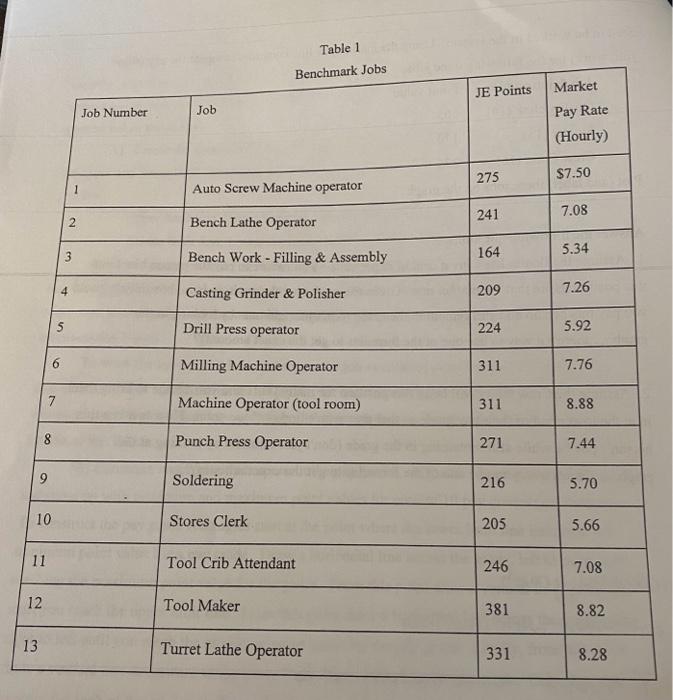
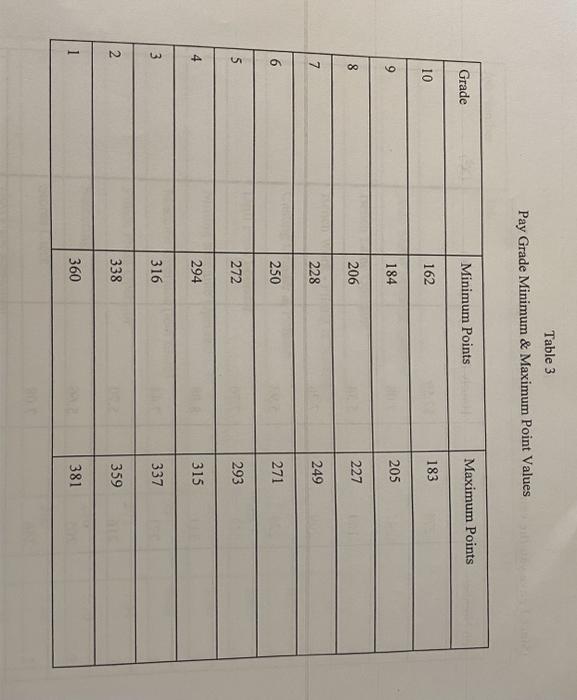
Jayhawk Manufacturing Company has recently identified 13 benchmark jobs and has evaluated them using the point method (see Table 1). They have also recently completed a pay survey of other manufacturing companies in the area and have compiled data indicating the current market rate for each of the 13 benchmark jobs (see Table 1). The company would now like to use this data and create a market pay line and pay grades. After completing this task, they would like to use the market pay line to determine the pay for other jobs that have been evaluated. 1. Create a scatterplot. Using the point values and pay survey results for the benchmark jobs, create a scatterplot of these points. On regular linear coordinate paper (81/211) plot the point ratings as the independent (X) variable along the 11 inch side of the paper, and the corresponding hourly rates as the dependent (Y) variable along the 81/2 inch side of the paper. Start both scales at zero in the lower left-hand corner and allow 1/2 inch for each 25 points and each $1.00. As you can see the points on your scatterplot will not fall on a smooth curve therefore a line of best fit must be determined and used as your market pay line. 2. Creating the market pay line. The general equation for the line is: Y=a+bX where Y is the predicted (or market) pay, X= job evaluation points, a= the Y intercept, and b= the slope of the line. Least squares linear regression is used to find the equation of best fit for the market pay line. (Note: Normally I have students solve a set of simultaneous equations to find the values of "a" and "b"......... This time, I am just going to give you the values: a=2.5756b=.0175) Use these values (do not round the values, use exactly what I have on the line above) to write the equation for the market pay line: Hourly pay =(a)+((b)x point value ) To draw the market pay line: substitute job evaluation point values of 100 and 300 into the market pay line equation and calculate the corresponding hourly pay rates. Plot these two points on the graph and draw a straight line through them, extending the line until it intersects the Y axis. This intersection of the y axis should agree with the (a) value from the market pay line quation. Create pay grades. While the Jayhawk Manufacturing Company will pursue a comparable pay policy, it would like to create pay grades that allow more flexibility. The company has decided that the upper limit of each grade will be 10 percent above the market while the lower limit will be 10 percent below the market. (A). Create the upper and lower limit lines on the graph. First create the equations for the upper and lower limit lines using the (a) and (b) values that were calculated for the market pay line. Upper limit line: Upper limit pay rate =1.10(a)+(1.10(b)x point value) Lower limit line: Lower limit pay rate =.90(a)+(.90(b) point value). To draw the upper limit line, substitute the job evaluation point values of 100 and 300 into the upper limit line equation and calculate the corresponding hourly pay rates. Plot these two points on the graph and draw a straight line through them, extending the line until it intersects the Y axis. To draw the lower limit line, substitute the job evaluation point values of 100 and 300 into the lower limit line equation and calculate the corresponding hourly pay rates. Plot these two points on the graph and draw a straight line through them, extending the line until it intersects the Y axis. (B) Construct rectangles that represent the pay grades. Jayhawk Manufacturing Company has come up with minimum and maximum point values for each of 10 pay grades (see Table 3 ). To construct the pay grade rectangles start at the point where the lower limit line intersects the minimum point value for a pay grade. Draw a horizontal line across the grade, left to right, until reaching the maximum point value for the grade. From this point draw a vertical line (going up) until you reach the upper limit line. From this point draw a horizontal line across the grade going right to left until you reach the minimum point value for the pay grade. Finally, from this point draw a vertical line downward to the lower limit line to complete the rectangle. Complete this process for each of the 10 pay grades. Are there any of the 13 jobs that fall above the pay range of their grade? If so, what ction would you recommend be taken for the job(s) to correct the situation? Place non benchmark jobs in the system. Assume that there are many other jobs at Jayhawk Manufacturing Company that now need to be worked in the system. Using the market pay line equation, compute the pay (show your work) for the followina thres : in. Plot (and label) these jobs on the graph. Answer the following questions: 1. Assume the floater has a great deal of experience. You decide to pay the person hired into this position more that the market rate. Given the grade that the position is in, how highly could you pay this person and still remain in the grade (don't just estimate by looking at the graph......there's a way to use one of the formulas to get the exact amount)? 2. Assume the Crew Chief will be in this position for many years and you decide to bring them in at the lower end of their pay grade so that they won't "top out" too soon. How low can this person's pay be while still remaining in the grade (don't just estimate by looking at the graph.....there's a way to use one of the formulas to get the exact amount)? Table 1 Benchmark Jobs Table 3 Pay Grade Minimum \& Maximum Point Values \begin{tabular}{|l|l|l|} \hline Grade & Minimum Points & Maximum Points \\ \hline 10 & 162 & 183 \\ \hline 9 & 184 & 205 \\ \hline 8 & 206 & 227 \\ \hline 7 & 228 & 249 \\ \hline 6 & 250 & 271 \\ \hline 5 & 272 & 293 \\ \hline 4 & 294 & 315 \\ \hline 3 & 316 & 337 \\ \hline 2 & 338 & 359 \\ \hline 1 & 360 & 381 \\ \hline \end{tabular} Jayhawk Manufacturing Company has recently identified 13 benchmark jobs and has evaluated them using the point method (see Table 1). They have also recently completed a pay survey of other manufacturing companies in the area and have compiled data indicating the current market rate for each of the 13 benchmark jobs (see Table 1). The company would now like to use this data and create a market pay line and pay grades. After completing this task, they would like to use the market pay line to determine the pay for other jobs that have been evaluated. 1. Create a scatterplot. Using the point values and pay survey results for the benchmark jobs, create a scatterplot of these points. On regular linear coordinate paper (81/211) plot the point ratings as the independent (X) variable along the 11 inch side of the paper, and the corresponding hourly rates as the dependent (Y) variable along the 81/2 inch side of the paper. Start both scales at zero in the lower left-hand corner and allow 1/2 inch for each 25 points and each $1.00. As you can see the points on your scatterplot will not fall on a smooth curve therefore a line of best fit must be determined and used as your market pay line. 2. Creating the market pay line. The general equation for the line is: Y=a+bX where Y is the predicted (or market) pay, X= job evaluation points, a= the Y intercept, and b= the slope of the line. Least squares linear regression is used to find the equation of best fit for the market pay line. (Note: Normally I have students solve a set of simultaneous equations to find the values of "a" and "b"......... This time, I am just going to give you the values: a=2.5756b=.0175) Use these values (do not round the values, use exactly what I have on the line above) to write the equation for the market pay line: Hourly pay =(a)+((b)x point value ) To draw the market pay line: substitute job evaluation point values of 100 and 300 into the market pay line equation and calculate the corresponding hourly pay rates. Plot these two points on the graph and draw a straight line through them, extending the line until it intersects the Y axis. This intersection of the y axis should agree with the (a) value from the market pay line quation. Create pay grades. While the Jayhawk Manufacturing Company will pursue a comparable pay policy, it would like to create pay grades that allow more flexibility. The company has decided that the upper limit of each grade will be 10 percent above the market while the lower limit will be 10 percent below the market. (A). Create the upper and lower limit lines on the graph. First create the equations for the upper and lower limit lines using the (a) and (b) values that were calculated for the market pay line. Upper limit line: Upper limit pay rate =1.10(a)+(1.10(b)x point value) Lower limit line: Lower limit pay rate =.90(a)+(.90(b) point value). To draw the upper limit line, substitute the job evaluation point values of 100 and 300 into the upper limit line equation and calculate the corresponding hourly pay rates. Plot these two points on the graph and draw a straight line through them, extending the line until it intersects the Y axis. To draw the lower limit line, substitute the job evaluation point values of 100 and 300 into the lower limit line equation and calculate the corresponding hourly pay rates. Plot these two points on the graph and draw a straight line through them, extending the line until it intersects the Y axis. (B) Construct rectangles that represent the pay grades. Jayhawk Manufacturing Company has come up with minimum and maximum point values for each of 10 pay grades (see Table 3 ). To construct the pay grade rectangles start at the point where the lower limit line intersects the minimum point value for a pay grade. Draw a horizontal line across the grade, left to right, until reaching the maximum point value for the grade. From this point draw a vertical line (going up) until you reach the upper limit line. From this point draw a horizontal line across the grade going right to left until you reach the minimum point value for the pay grade. Finally, from this point draw a vertical line downward to the lower limit line to complete the rectangle. Complete this process for each of the 10 pay grades. Are there any of the 13 jobs that fall above the pay range of their grade? If so, what ction would you recommend be taken for the job(s) to correct the situation? Place non benchmark jobs in the system. Assume that there are many other jobs at Jayhawk Manufacturing Company that now need to be worked in the system. Using the market pay line equation, compute the pay (show your work) for the followina thres : in. Plot (and label) these jobs on the graph. Answer the following questions: 1. Assume the floater has a great deal of experience. You decide to pay the person hired into this position more that the market rate. Given the grade that the position is in, how highly could you pay this person and still remain in the grade (don't just estimate by looking at the graph......there's a way to use one of the formulas to get the exact amount)? 2. Assume the Crew Chief will be in this position for many years and you decide to bring them in at the lower end of their pay grade so that they won't "top out" too soon. How low can this person's pay be while still remaining in the grade (don't just estimate by looking at the graph.....there's a way to use one of the formulas to get the exact amount)? Table 1 Benchmark Jobs Table 3 Pay Grade Minimum \& Maximum Point Values \begin{tabular}{|l|l|l|} \hline Grade & Minimum Points & Maximum Points \\ \hline 10 & 162 & 183 \\ \hline 9 & 184 & 205 \\ \hline 8 & 206 & 227 \\ \hline 7 & 228 & 249 \\ \hline 6 & 250 & 271 \\ \hline 5 & 272 & 293 \\ \hline 4 & 294 & 315 \\ \hline 3 & 316 & 337 \\ \hline 2 & 338 & 359 \\ \hline 1 & 360 & 381 \\ \hline \end{tabular}