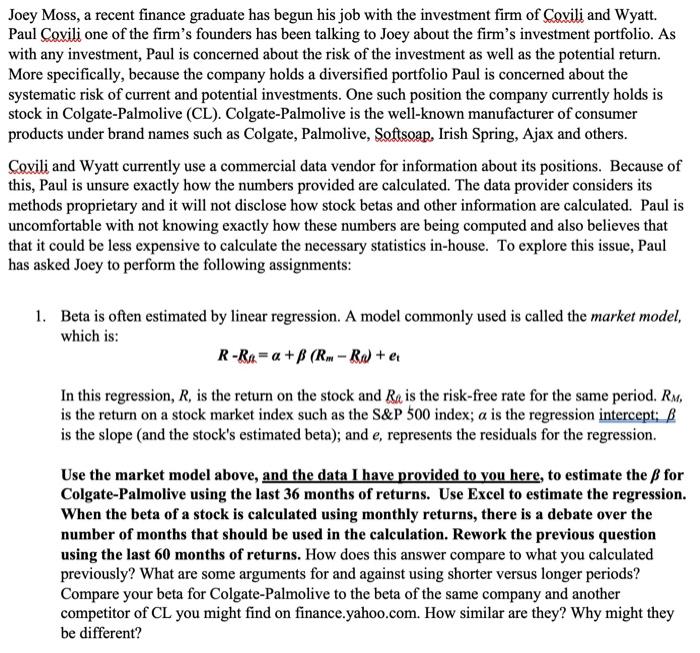
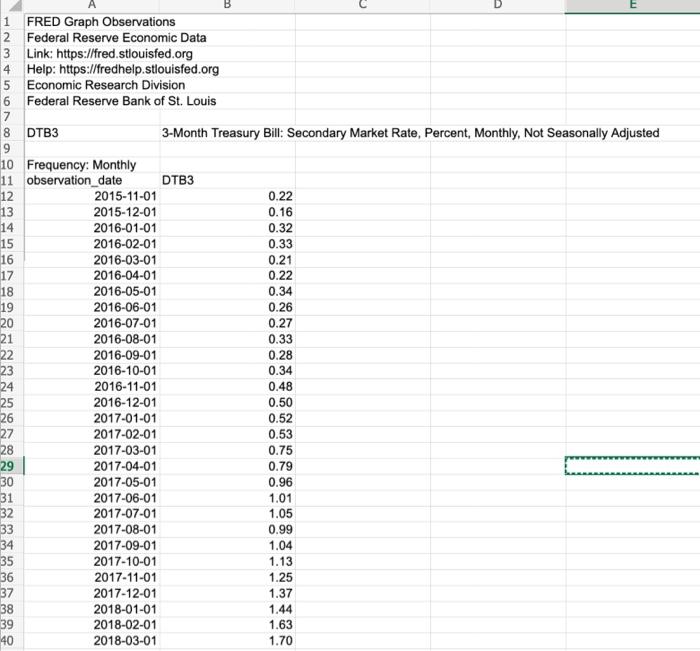
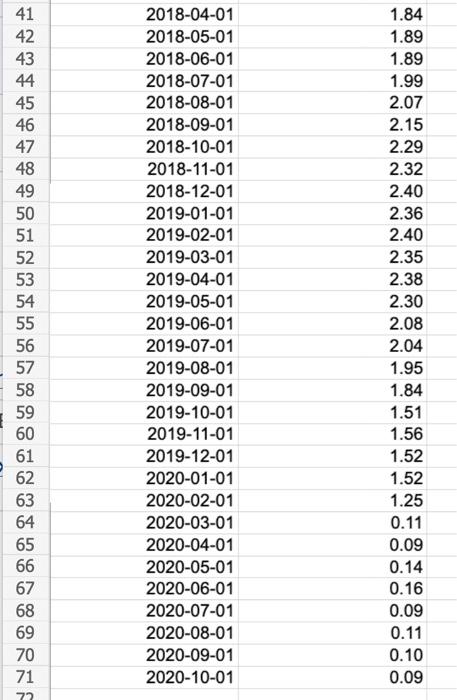
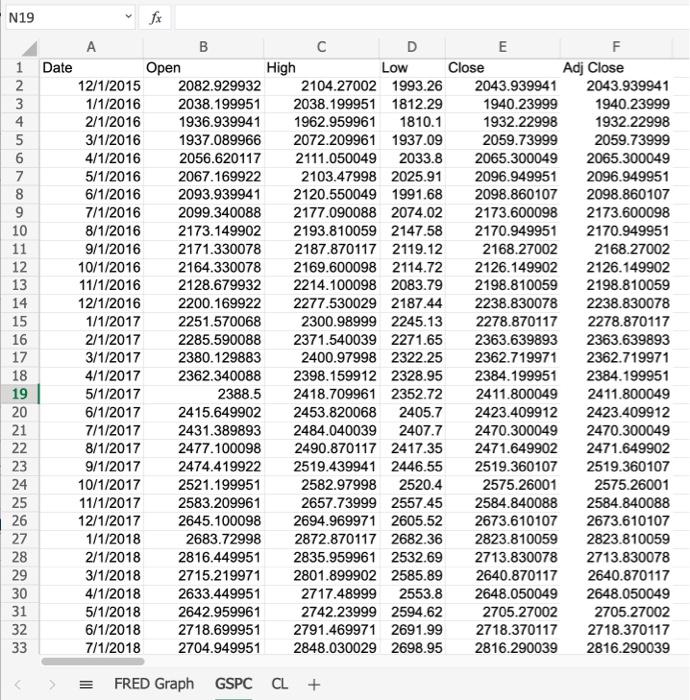
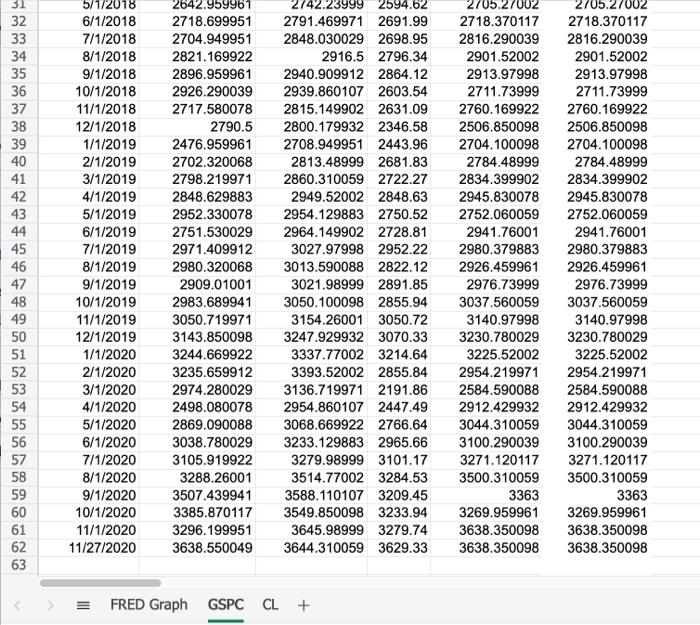
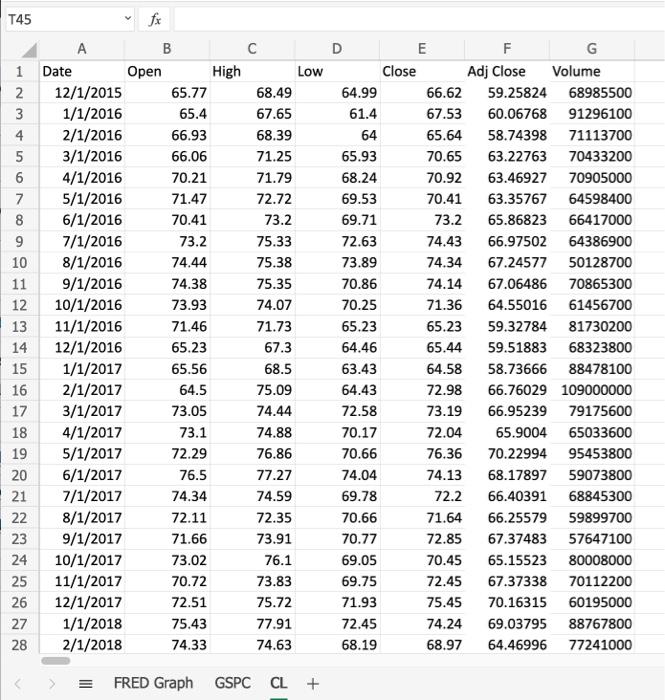
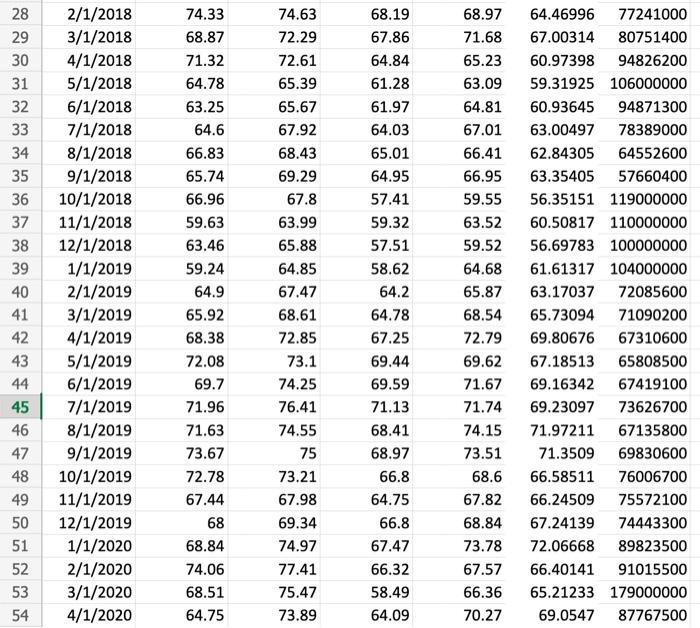
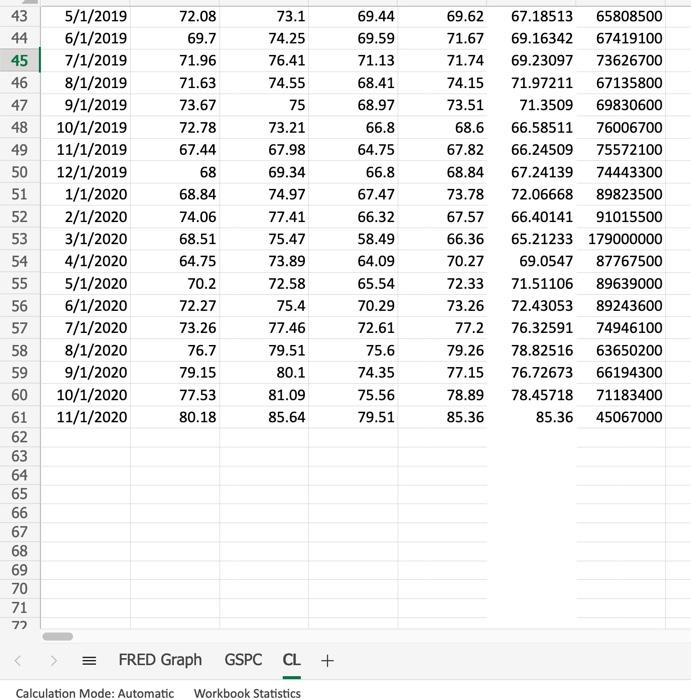
Joey Moss, a recent finance graduate has begun his job with the investment firm of Covili and Wyatt. Paul Covili one of the firm's founders has been talking to Joey about the firm's investment portfolio. As with any investment, Paul is concerned about the risk of the investment as well as the potential return. More specifically, because the company holds a diversified portfolio Paul is concerned about the systematic risk of current and potential investments. One such position the company currently holds is stock in Colgate-Palmolive (CL). Colgate-Palmolive is the well-known manufacturer of consumer products under brand names such as Colgate, Palmolive, Softsoap, Irish Spring, Ajax and others. Covili and Wyatt currently use a commercial data vendor for information about its positions. Because of this, Paul is unsure exactly how the numbers provided are calculated. The data provider considers its methods proprietary and it will not disclose how stock betas and other information are calculated. Paul is uncomfortable with not knowing exactly how these numbers are being computed and also believes that that it could be less expensive to calculate the necessary statistics in-house. To explore this issue, Paul has asked Joey to perform the following assignments: 1. Beta is often estimated by linear regression. A model commonly used is called the market model, which is: R-Ra=a+B (R.-RW + et In this regression, R, is the return on the stock and Ra is the risk-free rate for the same period. RM, is the return on a stock market index such as the S&P 500 index; a is the regression intercept: B is the slope (and the stock's estimated beta); and e, represents the residuals for the regression. Use the market model above, and the data I have provided to you here, to estimate the B for Colgate-Palmolive using the last 36 months of returns. Use Excel to estimate the regression. When the beta of a stock is calculated using monthly returns, there is a debate over the number of months that should be used in the calculation. Rework the previous question using the last 60 months of returns. How does this answer compare to what you calculated previously? What are some arguments for and against using shorter versus longer periods? Compare your beta for Colgate-Palmolive to the beta of the same company and another competitor of CL you might find on finance.yahoo.com. How similar are they? Why might they be different? 1 FRED Graph Observations 2 Federal Reserve Economic Data 3 Link: https://fred.stlouisfed.org 4 Help: https://fredhelp.stlouisfed.org 5 Economic Research Division 6 Federal Reserve Bank of St. Louis 7 8 DTB3 3-Month Treasury Bill: Secondary Market Rate, Percent, Monthly, Not Seasonally Adjusted 9 10 Frequency: Monthly 11 observation_date DTB3 12 2015-11-01 0.22 13 2015-12-01 0.16 14 2016-01-01 0.32 15 2016-02-01 0.33 16 2016-03-01 0.21 17 2016-04-01 0.22 18 2016-05-01 0.34 19 2016-06-01 0.26 20 2016-07-01 0.27 21 2016-08-01 0.33 22 2016-09-01 0.28 23 2016-10-01 0.34 24 2016-11-01 0.48 25 2016-12-01 0.50 26 2017-01-01 0.52 27 2017-02-01 0.53 28 2017-03-01 0.75 29 2017-04-01 0.79 30 2017-05-01 0.96 31 2017-06-01 1.01 32 2017-07-01 1.05 33 2017-08-01 0.99 34 2017-09-01 1.04 35 2017-10-01 1.13 36 2017-11-01 1.25 37 2017-12-01 1.37 38 2018-01-01 1.44 39 2018-02-01 1.63 40 2018-03-01 1.70 41 42 43 44. 45 46 47 48 49 50 51 52 53 54 55 56 57 58 59 60 61 62. 63 64 2018-04-01 2018-05-01 2018-06-01 2018-07-01 2018-08-01 2018-09-01 2018-10-01 2018-11-01 2018-12-01 2019-01-01 2019-02-01 2019-03-01 2019-04-01 2019-05-01 2019-06-01 2019-07-01 2019-08-01 2019-09-01 2019-10-01 2019-11-01 2019-12-01 2020-01-01 2020-02-01 2020-03-01 2020-04-01 2020-05-01 2020-06-01 2020-07-01 2020-08-01 2020-09-01 2020-10-01 1.84 1.89 1.89 1.99 2.07 2.15 2.29 2.32. 2.40 2.36 2.40 2.35 2.38 2.30 2.08 2.04 1.95 1.84 1.51 1.56 1.52 1.52 1.25 0.11 0.09 0.14 0.16 0.09 0.11 0.10 0.09. 65 66 67. 68 69 70 RAR N19 fx B D E F 1 Date Open High Low Close Adj Close 2 12/1/2015 2082.929932 2104.27002 1993.26 2043.939941 2043.939941 3 1/1/2016 2038.199951 2038.199951 1812.29 1940.23999 1940.23999 4 2/1/2016 1936.939941 1962.959961 1810.1 1932.22998 1932.22998 5 3/1/2016 1937.089966 2072.209961 1937.09 2059.73999 2059.73999 6 4/1/2016 2056.620117 2111.050049 2033.8 2065.300049 2065.300049 7 5/1/2016 2067.169922 2103.47998 2025.91 2096.949951 2096.949951 8 6/1/2016 2093.939941 2120.550049 1991.68 2098.860107 2098.860107 9 7/1/2016 2099.340088 2177.090088 2074.02 2173.600098 2173.600098 10 8/1/2016 2173.149902 2193.810059 2147.58 2170.949951 2170.949951 11 9/1/2016 2171.330078 2187.870117 2119.12 2168.27002 2168.27002 12 10/1/2016 2164.330078 2169.600098 2114.72 2126.149902 2126.149902 13 11/1/2016 2128.679932 2214.100098 2083.79 2198.810059 2198.810059 14 12/1/2016 2200.169922 2277.530029 2187.44 2238.830078 2238.830078 15 1/1/2017 2251.570068 2300.98999 2245.13 2278.870117 2278.870117 16 2/1/2017 2285.590088 2371.540039 2271.65 2363.639893 2363.639893 17 3/1/2017 2380.129883 2400.97998 2322.25 2362.719971 2362.719971 18 4/1/2017 2362.340088 2398.159912 2328.95 2384.199951 2384.199951 19 5/1/2017 2388.5 2418.709961 2352.72 2411.800049 2411.800049 20 6/1/2017 2415.649902 2453.820068 2405.7 2423.409912 2423.409912 21 7/1/2017 2431.389893 2484.040039 2407.7 2470.300049 2470.300049 22 8/1/2017 2477.100098 2490.870117 2417.35 2471.649902 2471.649902 23 9/1/2017 2474.419922 2519.439941 2446.55 2519.360107 2519.360107 24 10/1/2017 2521.199951 2582.97998 2520.4 2575.26001 2575.26001 25 11/1/2017 2583.209961 2657.73999 2557.45 2584.840088 2584.840088 26 12/1/2017 2645.100098 2694.969971 2605.52 2673.610107 2673.610107 27 1/1/2018 2683.72998 2872.870117 2682.36 2823.810059 2823.810059 28 2/1/2018 2816.449951 2835.959961 2532.69 2713.830078 2713.830078 29 3/1/2018 2715.219971 2801.899902 2585.89 2640.870117 2640.870117 30 4/1/2018 2633.449951 2717.48999 2553.8 2648.050049 2648.050049 31 5/1/2018 2642.959961 2742.23999 2594.62 2705.27002 2705.27002 32 6/1/2018 2718.699951 2791.469971 2691.99 2718.370117 2718.370117 33 7/1/2018 2704.949951 2848.030029 2698.95 2816.290039 2816.290039 FRED Graph GSPC CL + 31 32 33 34 35 36 37 38 39 40 41 42 43 4 45 46 47 48 9 50 51 52 53 54 55 56 57 58 59 60 61 62 63 5/1/2018 6/1/2018 7/1/2018 8/1/2018 9/1/2018 10/1/2018 11/1/2018 12/1/2018 | 1/1/2019 2/1/2019 3/1/2019 4/1/2019 5/1/2019 6/1/2019 7/1/2019 8/1/2019 9/1/2019 10/1/2019 11/1/2019 12/1/2019 1/1/2020 2/1/2020 3/1/2020 4/1/2020 5/1/2020 6/1/2020 7/1/2020 8/1/2020 9/1/2020 10/1/2020 11/1/2020 11/27/2020 2642.959951 2718.699951 2704.949951 2821.169922 2896.959961 2926.290039 2717.580078 2790.5 2476.959961 2702.320068 2798.219971 2848.629883 2952.330078 2751.530029 2971.409912 2980.320068 2909.01001 2983.689941 3050.719971 3143.850098 3244.669922 3235.659912 2974.280029 2498.080078 2869.090088 3038.780029 3105.919922 3288.26001 3507.439941 3385.870117 3296.199951 3638.550049 274223999 2594.52 2791.469971 2691.99 2848.030029 2698.95 2916.5 2796.34 2940.909912 2864.12 2939.860107 2603.54 2815.149902 2631.09 2800.179932 2346.58 2708.949951 2443.96 2813.48999 2681.83 2860.310059 2722.27 2949.52002 2848.63 2954.129883 2750.52 2964.149902 2728.81 3027.97998 2952.22 3013.590088 2822.12 3021.98999 2891.85 3050.100098 2855.94 3154.26001 3050.72 3247.929932 3070.33 3337.77002 3214.64 3393.52002 2855.84 3136.719971 2191.86 2954.860107 2447.49 3068.669922 2766.64 3233.129883 2965.66 3279.98999 3101.17 13514.77002 3284.53 3588.110107 3209.45 3549.850098 3233.94 3645.98999 3279.74 3644.310059 3629.33 2705,27ODE 2718.370117 2816.290039 2901.52002 2913.97998 2711.73999 2760.169922 2506,850098 2704.100098 2784.48999 2834.399902 2945.830078 2752.060059 2941.76001 2980.379883 2926.459961 2976.73999 3037.560059 3140.97998 3230.780029 3225.52002 2954.219971 2584.590088 2912.429932 3044.310059 3100.290039 3271.120117 3500.310059 3363 3269.959961 3638.350098 3638.350098 70527002 2718.370117 2816.290039 2901.52002 2913.97998 2711.73999 2760.169922 2506.850098 2704.100098 2784.48999 2834.399902 2945.830078 2752.060059 2941.76001 2980.379883 2926.459961 2976.73999 3037.560059 3140.97998 3230.780029 3225.52002 2954.219971 2584.590088 2912.429932 3044.310059 13100.290039 3271.12017 13500.310059 3363 3269.959961 3638.350098 3638.350098 FRED Graph GSPC CL + T45 f A B 1 Date Open High 2 12/1/2015 65.77 3 1/1/2016 65.4 4 2/1/2016 66.93 5 3/1/2016 66.06 6 4/1/2016 70.21 7 5/1/2016 71.47 8 6/1/2016 70.41 9 7/1/2016 73.2 10 8/1/2016 74.44 11 9/1/2016 74.38 12 10/1/2016 73.93 13 11/1/2016 71.46 14 12/1/2016 65.23 15 1/1/2017 65.56 16 2/1/2017 64.5 17 3/1/2017 73.05 18 4/1/2017 73.1 19 5/1/2017 72.29 20 6/1/2017 76.5 21 7/1/2017 74.34 22 8/1/2017 72.11 23 9/1/2017 71.66 24 10/1/2017 73.02 25 11/1/2017 70.72 26 12/1/2017 72.51 27 1/1/2018 75.43 28 2/1/2018 74.33 D E F G Low Close Adj Close Volume 68.49 64.99 66.62 59.25824 68985500 67.65 61.4 67.53 60.06768 91296100 68.39 64 65.64 58.74398 71113700 71.25 65.93 70.65 63.22763 70433200 71.79 68.24 70.92 63.46927 70905000 72.72 69.53 70.41 63.35767 64598400 73.2 69.71 73.2 65.86823 66417000 75.33 72.63 74.43 66.97502 64386900 75.38 73.89 74.34 67.24577 50128700 75.35 70.86 74.14 67.06486 70865300 74.07 70.25 71.36 64.55016 61456700 71.73 65.23 65.23 59.32784 81730200 67.3 64.46 65.44 59.51883 68323800 68.5 63.43 64.58 58.73666 88478100 75.09 64.43 72.98 66.76029 109000000 74.44 72.58 73.19 66.95239 79175600 74.88 70.17 72.04 65.9004 65033600 76.86 70.66 76.36 70.22994 95453800 77.27 74.04 74.13 68.17897 59073800 74.59 69.78 72.2 66.40391 68845300 72.35 70.66 71.64 66.25579 59899700 73.91 70.77 72.85 67.37483 57647100 76.1 69.05 70.45 65.15523 80008000 73.83 69.75 72.45 67.37338 70112200 75.72 71.93 75.45 70.16315 60195000 77.91 72.45 74.24 69.03795 88767800 74.63 68.19 68.97 64.46996 77241000 E FRED Graph GSPC CL + 28 29 30 31 32 33 34 35 36 37 38 39 40 41 42 43 44 45 46 47 48 49 50 51 52 53 54 2/1/2018 3/1/2018 4/1/2018 5/1/2018 6/1/2018 7/1/2018 8/1/2018 9/1/2018 10/1/2018 11/1/2018 12/1/2018 1/1/2019 2/1/2019 3/1/2019 4/1/2019 5/1/2019 6/1/2019 7/1/2019 8/1/2019 9/1/2019 10/1/2019 11/1/2019 12/1/2019 1/1/2020 2/1/2020 3/1/2020 4/1/2020 74.33 68.87 71.32 64.78 63.25 64.6 66.83 65.74 66.96 59.63 63.46 59.24 64.9 65.92 68.38 72.08 69.7 71.96 71.63 73.67 72.78 67.44 68 68.84 74.06 68.51 64.75 74.63 72.29 72.61 65.39 65.67 67.92 68.43 69.29 67.8 63.99 65.8 64.85 67.47 68.61 72.85 73.1 74.25 76.41 74.55 75 73.21 67.98 69.34 74.97 77.41 75.47 73.89 68.19 67.86 64.84 61.28 61.97 64.03 65.01 64.95 57.41 59.32 57.51 58.62 64.2 64.78 67.25 69.44 69.59 71.13 68.41 68.97 66.8 64.75 66.8 67.47 66.32 58.49 64.09 68.97 71.68 65.23 63.09 64.81 67.01 66.41 66.95 59.55 63.52 59.52 64.68 65.87 68.54 72.79 69.62 171.67 71.74 74.15 73.51 68.6 67.82 68.84 73.78 67.57 66.36 70.27 64.46996 77241000 67.00314 80751400 60.97398 94826200 59.31925 106000000 60.93645 94871300 63.00497 78389000 62.84305 64552600 63.35405 57660400 56.35151 119000000 60.50817 110000000 56.69783 100000000 61.61317 104000000 63.17037 72085600 65.73094 71090200 69.80676 67310600 67.18513 65808500 69.16342 67419100 69.23097 73626700 71.97211 67135800 71.3509 69830600 66.58511 76006700 66.24509 75572100 67.24139 74443300 72.06668 89823500 66.40141 91015500 65.21233 179000000 69.0547 87767500 43 44 45 46 47 48 49 50 51 52 53 54 55 56 57 58 59 60 61 62 63 64 65 66 67 68 69 70 5/1/2019 6/1/2019 7/1/2019 8/1/2019 9/1/2019 10/1/2019 11/1/2019 12/1/2019 1/1/2020 2/1/2020 3/1/2020 4/1/2020 5/1/2020 6/1/2020 7/1/2020 8/1/2020 9/1/2020 10/1/2020 11/1/2020 72.08 69.7 71.96 71.63 73.67 72.78 67.44 68 68.84 74.06 68.51 64.75 70.2 72.27 73.26 76.7 79.15 77.53 80.18 73.1 74.25 76.41 74.55 75 73.21 67.98 69.34 74.97 77.41 75.47 73.89 72.58 75.4 77.46 79.51 80.1 81.09 85.64 69.44 69.59 71.13 68.41 68.97 66.8 64.75 66.8 67.47 66.32 58.49 64.09 65.54 70.29 72.61 75.6 74.35 75.56 79.51 69.62 71.67 71.74 74.15 73.51 68.6 67.82 68.84 73.78 67.57 66.36 70.27 72.33 73.26 77.2 79.26 77.15 78.89 85.36 67.18513 65808500 69.16342 67419100 69.23097 73626700 71.97211 67135800 71.3509 69830600 66.58511 76006700 66.24509 75572100 67.24139 74443300 72.06668 89823500 66.40141 91015500 65.21233 179000000 69.0547 87767500 71.51106 89639000 72.43053 89243600 76.32591 74946100 78.82516 63650200 76.72673 66194300 78.45718 71183400 85.36 45067000 71 72 = FRED Graph GSPC CL + Calculation Mode: Automatic Workbook Statistics Joey Moss, a recent finance graduate has begun his job with the investment firm of Covili and Wyatt. Paul Covili one of the firm's founders has been talking to Joey about the firm's investment portfolio. As with any investment, Paul is concerned about the risk of the investment as well as the potential return. More specifically, because the company holds a diversified portfolio Paul is concerned about the systematic risk of current and potential investments. One such position the company currently holds is stock in Colgate-Palmolive (CL). Colgate-Palmolive is the well-known manufacturer of consumer products under brand names such as Colgate, Palmolive, Softsoap, Irish Spring, Ajax and others. Covili and Wyatt currently use a commercial data vendor for information about its positions. Because of this, Paul is unsure exactly how the numbers provided are calculated. The data provider considers its methods proprietary and it will not disclose how stock betas and other information are calculated. Paul is uncomfortable with not knowing exactly how these numbers are being computed and also believes that that it could be less expensive to calculate the necessary statistics in-house. To explore this issue, Paul has asked Joey to perform the following assignments: 1. Beta is often estimated by linear regression. A model commonly used is called the market model, which is: R-Ra=a+B (R.-RW + et In this regression, R, is the return on the stock and Ra is the risk-free rate for the same period. RM, is the return on a stock market index such as the S&P 500 index; a is the regression intercept: B is the slope (and the stock's estimated beta); and e, represents the residuals for the regression. Use the market model above, and the data I have provided to you here, to estimate the B for Colgate-Palmolive using the last 36 months of returns. Use Excel to estimate the regression. When the beta of a stock is calculated using monthly returns, there is a debate over the number of months that should be used in the calculation. Rework the previous question using the last 60 months of returns. How does this answer compare to what you calculated previously? What are some arguments for and against using shorter versus longer periods? Compare your beta for Colgate-Palmolive to the beta of the same company and another competitor of CL you might find on finance.yahoo.com. How similar are they? Why might they be different? 1 FRED Graph Observations 2 Federal Reserve Economic Data 3 Link: https://fred.stlouisfed.org 4 Help: https://fredhelp.stlouisfed.org 5 Economic Research Division 6 Federal Reserve Bank of St. Louis 7 8 DTB3 3-Month Treasury Bill: Secondary Market Rate, Percent, Monthly, Not Seasonally Adjusted 9 10 Frequency: Monthly 11 observation_date DTB3 12 2015-11-01 0.22 13 2015-12-01 0.16 14 2016-01-01 0.32 15 2016-02-01 0.33 16 2016-03-01 0.21 17 2016-04-01 0.22 18 2016-05-01 0.34 19 2016-06-01 0.26 20 2016-07-01 0.27 21 2016-08-01 0.33 22 2016-09-01 0.28 23 2016-10-01 0.34 24 2016-11-01 0.48 25 2016-12-01 0.50 26 2017-01-01 0.52 27 2017-02-01 0.53 28 2017-03-01 0.75 29 2017-04-01 0.79 30 2017-05-01 0.96 31 2017-06-01 1.01 32 2017-07-01 1.05 33 2017-08-01 0.99 34 2017-09-01 1.04 35 2017-10-01 1.13 36 2017-11-01 1.25 37 2017-12-01 1.37 38 2018-01-01 1.44 39 2018-02-01 1.63 40 2018-03-01 1.70 41 42 43 44. 45 46 47 48 49 50 51 52 53 54 55 56 57 58 59 60 61 62. 63 64 2018-04-01 2018-05-01 2018-06-01 2018-07-01 2018-08-01 2018-09-01 2018-10-01 2018-11-01 2018-12-01 2019-01-01 2019-02-01 2019-03-01 2019-04-01 2019-05-01 2019-06-01 2019-07-01 2019-08-01 2019-09-01 2019-10-01 2019-11-01 2019-12-01 2020-01-01 2020-02-01 2020-03-01 2020-04-01 2020-05-01 2020-06-01 2020-07-01 2020-08-01 2020-09-01 2020-10-01 1.84 1.89 1.89 1.99 2.07 2.15 2.29 2.32. 2.40 2.36 2.40 2.35 2.38 2.30 2.08 2.04 1.95 1.84 1.51 1.56 1.52 1.52 1.25 0.11 0.09 0.14 0.16 0.09 0.11 0.10 0.09. 65 66 67. 68 69 70 RAR N19 fx B D E F 1 Date Open High Low Close Adj Close 2 12/1/2015 2082.929932 2104.27002 1993.26 2043.939941 2043.939941 3 1/1/2016 2038.199951 2038.199951 1812.29 1940.23999 1940.23999 4 2/1/2016 1936.939941 1962.959961 1810.1 1932.22998 1932.22998 5 3/1/2016 1937.089966 2072.209961 1937.09 2059.73999 2059.73999 6 4/1/2016 2056.620117 2111.050049 2033.8 2065.300049 2065.300049 7 5/1/2016 2067.169922 2103.47998 2025.91 2096.949951 2096.949951 8 6/1/2016 2093.939941 2120.550049 1991.68 2098.860107 2098.860107 9 7/1/2016 2099.340088 2177.090088 2074.02 2173.600098 2173.600098 10 8/1/2016 2173.149902 2193.810059 2147.58 2170.949951 2170.949951 11 9/1/2016 2171.330078 2187.870117 2119.12 2168.27002 2168.27002 12 10/1/2016 2164.330078 2169.600098 2114.72 2126.149902 2126.149902 13 11/1/2016 2128.679932 2214.100098 2083.79 2198.810059 2198.810059 14 12/1/2016 2200.169922 2277.530029 2187.44 2238.830078 2238.830078 15 1/1/2017 2251.570068 2300.98999 2245.13 2278.870117 2278.870117 16 2/1/2017 2285.590088 2371.540039 2271.65 2363.639893 2363.639893 17 3/1/2017 2380.129883 2400.97998 2322.25 2362.719971 2362.719971 18 4/1/2017 2362.340088 2398.159912 2328.95 2384.199951 2384.199951 19 5/1/2017 2388.5 2418.709961 2352.72 2411.800049 2411.800049 20 6/1/2017 2415.649902 2453.820068 2405.7 2423.409912 2423.409912 21 7/1/2017 2431.389893 2484.040039 2407.7 2470.300049 2470.300049 22 8/1/2017 2477.100098 2490.870117 2417.35 2471.649902 2471.649902 23 9/1/2017 2474.419922 2519.439941 2446.55 2519.360107 2519.360107 24 10/1/2017 2521.199951 2582.97998 2520.4 2575.26001 2575.26001 25 11/1/2017 2583.209961 2657.73999 2557.45 2584.840088 2584.840088 26 12/1/2017 2645.100098 2694.969971 2605.52 2673.610107 2673.610107 27 1/1/2018 2683.72998 2872.870117 2682.36 2823.810059 2823.810059 28 2/1/2018 2816.449951 2835.959961 2532.69 2713.830078 2713.830078 29 3/1/2018 2715.219971 2801.899902 2585.89 2640.870117 2640.870117 30 4/1/2018 2633.449951 2717.48999 2553.8 2648.050049 2648.050049 31 5/1/2018 2642.959961 2742.23999 2594.62 2705.27002 2705.27002 32 6/1/2018 2718.699951 2791.469971 2691.99 2718.370117 2718.370117 33 7/1/2018 2704.949951 2848.030029 2698.95 2816.290039 2816.290039 FRED Graph GSPC CL + 31 32 33 34 35 36 37 38 39 40 41 42 43 4 45 46 47 48 9 50 51 52 53 54 55 56 57 58 59 60 61 62 63 5/1/2018 6/1/2018 7/1/2018 8/1/2018 9/1/2018 10/1/2018 11/1/2018 12/1/2018 | 1/1/2019 2/1/2019 3/1/2019 4/1/2019 5/1/2019 6/1/2019 7/1/2019 8/1/2019 9/1/2019 10/1/2019 11/1/2019 12/1/2019 1/1/2020 2/1/2020 3/1/2020 4/1/2020 5/1/2020 6/1/2020 7/1/2020 8/1/2020 9/1/2020 10/1/2020 11/1/2020 11/27/2020 2642.959951 2718.699951 2704.949951 2821.169922 2896.959961 2926.290039 2717.580078 2790.5 2476.959961 2702.320068 2798.219971 2848.629883 2952.330078 2751.530029 2971.409912 2980.320068 2909.01001 2983.689941 3050.719971 3143.850098 3244.669922 3235.659912 2974.280029 2498.080078 2869.090088 3038.780029 3105.919922 3288.26001 3507.439941 3385.870117 3296.199951 3638.550049 274223999 2594.52 2791.469971 2691.99 2848.030029 2698.95 2916.5 2796.34 2940.909912 2864.12 2939.860107 2603.54 2815.149902 2631.09 2800.179932 2346.58 2708.949951 2443.96 2813.48999 2681.83 2860.310059 2722.27 2949.52002 2848.63 2954.129883 2750.52 2964.149902 2728.81 3027.97998 2952.22 3013.590088 2822.12 3021.98999 2891.85 3050.100098 2855.94 3154.26001 3050.72 3247.929932 3070.33 3337.77002 3214.64 3393.52002 2855.84 3136.719971 2191.86 2954.860107 2447.49 3068.669922 2766.64 3233.129883 2965.66 3279.98999 3101.17 13514.77002 3284.53 3588.110107 3209.45 3549.850098 3233.94 3645.98999 3279.74 3644.310059 3629.33 2705,27ODE 2718.370117 2816.290039 2901.52002 2913.97998 2711.73999 2760.169922 2506,850098 2704.100098 2784.48999 2834.399902 2945.830078 2752.060059 2941.76001 2980.379883 2926.459961 2976.73999 3037.560059 3140.97998 3230.780029 3225.52002 2954.219971 2584.590088 2912.429932 3044.310059 3100.290039 3271.120117 3500.310059 3363 3269.959961 3638.350098 3638.350098 70527002 2718.370117 2816.290039 2901.52002 2913.97998 2711.73999 2760.169922 2506.850098 2704.100098 2784.48999 2834.399902 2945.830078 2752.060059 2941.76001 2980.379883 2926.459961 2976.73999 3037.560059 3140.97998 3230.780029 3225.52002 2954.219971 2584.590088 2912.429932 3044.310059 13100.290039 3271.12017 13500.310059 3363 3269.959961 3638.350098 3638.350098 FRED Graph GSPC CL + T45 f A B 1 Date Open High 2 12/1/2015 65.77 3 1/1/2016 65.4 4 2/1/2016 66.93 5 3/1/2016 66.06 6 4/1/2016 70.21 7 5/1/2016 71.47 8 6/1/2016 70.41 9 7/1/2016 73.2 10 8/1/2016 74.44 11 9/1/2016 74.38 12 10/1/2016 73.93 13 11/1/2016 71.46 14 12/1/2016 65.23 15 1/1/2017 65.56 16 2/1/2017 64.5 17 3/1/2017 73.05 18 4/1/2017 73.1 19 5/1/2017 72.29 20 6/1/2017 76.5 21 7/1/2017 74.34 22 8/1/2017 72.11 23 9/1/2017 71.66 24 10/1/2017 73.02 25 11/1/2017 70.72 26 12/1/2017 72.51 27 1/1/2018 75.43 28 2/1/2018 74.33 D E F G Low Close Adj Close Volume 68.49 64.99 66.62 59.25824 68985500 67.65 61.4 67.53 60.06768 91296100 68.39 64 65.64 58.74398 71113700 71.25 65.93 70.65 63.22763 70433200 71.79 68.24 70.92 63.46927 70905000 72.72 69.53 70.41 63.35767 64598400 73.2 69.71 73.2 65.86823 66417000 75.33 72.63 74.43 66.97502 64386900 75.38 73.89 74.34 67.24577 50128700 75.35 70.86 74.14 67.06486 70865300 74.07 70.25 71.36 64.55016 61456700 71.73 65.23 65.23 59.32784 81730200 67.3 64.46 65.44 59.51883 68323800 68.5 63.43 64.58 58.73666 88478100 75.09 64.43 72.98 66.76029 109000000 74.44 72.58 73.19 66.95239 79175600 74.88 70.17 72.04 65.9004 65033600 76.86 70.66 76.36 70.22994 95453800 77.27 74.04 74.13 68.17897 59073800 74.59 69.78 72.2 66.40391 68845300 72.35 70.66 71.64 66.25579 59899700 73.91 70.77 72.85 67.37483 57647100 76.1 69.05 70.45 65.15523 80008000 73.83 69.75 72.45 67.37338 70112200 75.72 71.93 75.45 70.16315 60195000 77.91 72.45 74.24 69.03795 88767800 74.63 68.19 68.97 64.46996 77241000 E FRED Graph GSPC CL + 28 29 30 31 32 33 34 35 36 37 38 39 40 41 42 43 44 45 46 47 48 49 50 51 52 53 54 2/1/2018 3/1/2018 4/1/2018 5/1/2018 6/1/2018 7/1/2018 8/1/2018 9/1/2018 10/1/2018 11/1/2018 12/1/2018 1/1/2019 2/1/2019 3/1/2019 4/1/2019 5/1/2019 6/1/2019 7/1/2019 8/1/2019 9/1/2019 10/1/2019 11/1/2019 12/1/2019 1/1/2020 2/1/2020 3/1/2020 4/1/2020 74.33 68.87 71.32 64.78 63.25 64.6 66.83 65.74 66.96 59.63 63.46 59.24 64.9 65.92 68.38 72.08 69.7 71.96 71.63 73.67 72.78 67.44 68 68.84 74.06 68.51 64.75 74.63 72.29 72.61 65.39 65.67 67.92 68.43 69.29 67.8 63.99 65.8 64.85 67.47 68.61 72.85 73.1 74.25 76.41 74.55 75 73.21 67.98 69.34 74.97 77.41 75.47 73.89 68.19 67.86 64.84 61.28 61.97 64.03 65.01 64.95 57.41 59.32 57.51 58.62 64.2 64.78 67.25 69.44 69.59 71.13 68.41 68.97 66.8 64.75 66.8 67.47 66.32 58.49 64.09 68.97 71.68 65.23 63.09 64.81 67.01 66.41 66.95 59.55 63.52 59.52 64.68 65.87 68.54 72.79 69.62 171.67 71.74 74.15 73.51 68.6 67.82 68.84 73.78 67.57 66.36 70.27 64.46996 77241000 67.00314 80751400 60.97398 94826200 59.31925 106000000 60.93645 94871300 63.00497 78389000 62.84305 64552600 63.35405 57660400 56.35151 119000000 60.50817 110000000 56.69783 100000000 61.61317 104000000 63.17037 72085600 65.73094 71090200 69.80676 67310600 67.18513 65808500 69.16342 67419100 69.23097 73626700 71.97211 67135800 71.3509 69830600 66.58511 76006700 66.24509 75572100 67.24139 74443300 72.06668 89823500 66.40141 91015500 65.21233 179000000 69.0547 87767500 43 44 45 46 47 48 49 50 51 52 53 54 55 56 57 58 59 60 61 62 63 64 65 66 67 68 69 70 5/1/2019 6/1/2019 7/1/2019 8/1/2019 9/1/2019 10/1/2019 11/1/2019 12/1/2019 1/1/2020 2/1/2020 3/1/2020 4/1/2020 5/1/2020 6/1/2020 7/1/2020 8/1/2020 9/1/2020 10/1/2020 11/1/2020 72.08 69.7 71.96 71.63 73.67 72.78 67.44 68 68.84 74.06 68.51 64.75 70.2 72.27 73.26 76.7 79.15 77.53 80.18 73.1 74.25 76.41 74.55 75 73.21 67.98 69.34 74.97 77.41 75.47 73.89 72.58 75.4 77.46 79.51 80.1 81.09 85.64 69.44 69.59 71.13 68.41 68.97 66.8 64.75 66.8 67.47 66.32 58.49 64.09 65.54 70.29 72.61 75.6 74.35 75.56 79.51 69.62 71.67 71.74 74.15 73.51 68.6 67.82 68.84 73.78 67.57 66.36 70.27 72.33 73.26 77.2 79.26 77.15 78.89 85.36 67.18513 65808500 69.16342 67419100 69.23097 73626700 71.97211 67135800 71.3509 69830600 66.58511 76006700 66.24509 75572100 67.24139 74443300 72.06668 89823500 66.40141 91015500 65.21233 179000000 69.0547 87767500 71.51106 89639000 72.43053 89243600 76.32591 74946100 78.82516 63650200 76.72673 66194300 78.45718 71183400 85.36 45067000 71 72 = FRED Graph GSPC CL + Calculation Mode: Automatic Workbook Statistics
