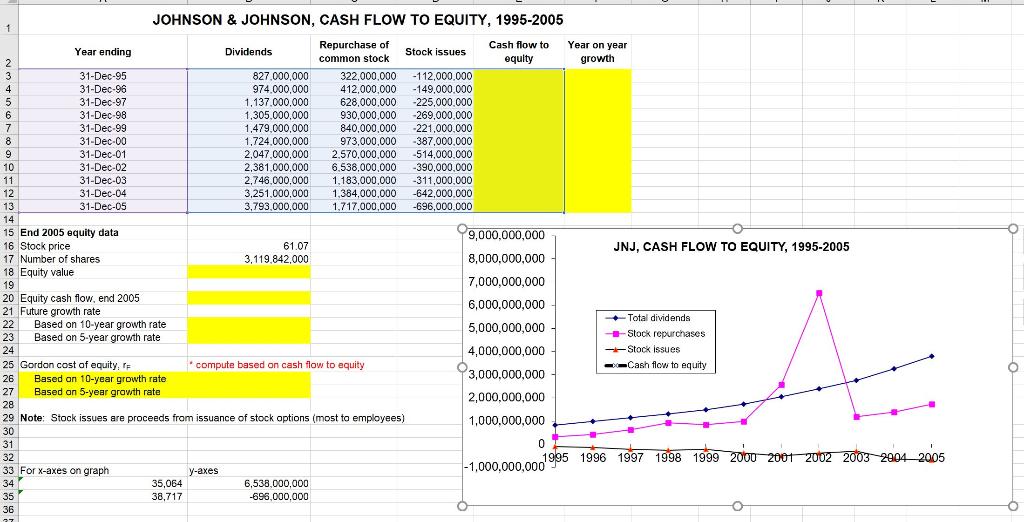
JOHNSON & JOHNSON, CASH FLOW TO EQUITY, 1995-2005 1 Cash flow to Repurchase of Year on year Year ending Dividends 2 Stock issues common stock equity growth 3 31-Dec-95 827,000,000 322,000,000 -112,000,000 4 4 31-Dec-96 974,000,000 412,000,000 - 149,000,000 5 31-Dec-97 1.137.000.000 628,000,000 -225,000.000 6 31-Dec-98 1,305,000,000 930,000,000 -269,000,000 7 31-Dec-99 1,479,000,000 840,000,000 -221.000.000 8 8 31-Dec-00 1,724,000,000 973,000,000 -387.000.000 9 31-Dec-01 2,047.000.000 2.570,000,000 -514,000,000 10 31-Dec-02 2,381,000,000 6.538,000,000 -390,000,000 11 31-Dec-03 2,746,000,000 1,183,000,000 -311.000.000 12 31-Dec-04 3,251,000,000 1,384,000,000 -642,000,000 13 31-Dec-05 3,793,000,000 1,717,000,000 -696,000.000 14 15 End 2005 equity data 99,000,000,000 16 Stock price 61.07 JNJ, CASH FLOW TO EQUITY, 1995-2005 17 Number of shares 3,119.842.000 8,000,000,000 18 Equity value 19 7,000,000,000 20 Equity cash flow, end 2005 21 Future growth rate 6,000,000,000 Total dividends 22 Based on 10-year growth rate 5,000,000,000 23 Based on 5-year growth rate +-Stock repurchases 24 4,000,000,000 Stock issues 25 Gordon cost of equity, le compute based on cash flow to equity Cash flow to equity 26 Based on 10-year growth rate 3,000,000,000 27 Based on 5-year growth rate 2,000,000,000 28 29 Note: Stock issues are proceeds from issuance of stock options (most to employees) 1,000,000,000 30 31 0 32 1995 1996 1997 1998 1999 2000 2001 2002 2003 2004 2005 2000 33 For X-axes on graph y-axes -1,000,000,000 34 35,064 6,538,000,000 35 38,717 -696,000.000 36 A JOHNSON & JOHNSON, CASH FLOW TO EQUITY, 1995-2005 1 Cash flow to Repurchase of Year on year Year ending Dividends 2 Stock issues common stock equity growth 3 31-Dec-95 827,000,000 322,000,000 -112,000,000 4 4 31-Dec-96 974,000,000 412,000,000 - 149,000,000 5 31-Dec-97 1.137.000.000 628,000,000 -225,000.000 6 31-Dec-98 1,305,000,000 930,000,000 -269,000,000 7 31-Dec-99 1,479,000,000 840,000,000 -221.000.000 8 8 31-Dec-00 1,724,000,000 973,000,000 -387.000.000 9 31-Dec-01 2,047.000.000 2.570,000,000 -514,000,000 10 31-Dec-02 2,381,000,000 6.538,000,000 -390,000,000 11 31-Dec-03 2,746,000,000 1,183,000,000 -311.000.000 12 31-Dec-04 3,251,000,000 1,384,000,000 -642,000,000 13 31-Dec-05 3,793,000,000 1,717,000,000 -696,000.000 14 15 End 2005 equity data 99,000,000,000 16 Stock price 61.07 JNJ, CASH FLOW TO EQUITY, 1995-2005 17 Number of shares 3,119.842.000 8,000,000,000 18 Equity value 19 7,000,000,000 20 Equity cash flow, end 2005 21 Future growth rate 6,000,000,000 Total dividends 22 Based on 10-year growth rate 5,000,000,000 23 Based on 5-year growth rate +-Stock repurchases 24 4,000,000,000 Stock issues 25 Gordon cost of equity, le compute based on cash flow to equity Cash flow to equity 26 Based on 10-year growth rate 3,000,000,000 27 Based on 5-year growth rate 2,000,000,000 28 29 Note: Stock issues are proceeds from issuance of stock options (most to employees) 1,000,000,000 30 31 0 32 1995 1996 1997 1998 1999 2000 2001 2002 2003 2004 2005 2000 33 For X-axes on graph y-axes -1,000,000,000 34 35,064 6,538,000,000 35 38,717 -696,000.000 36 A