Answered step by step
Verified Expert Solution
Question
1 Approved Answer
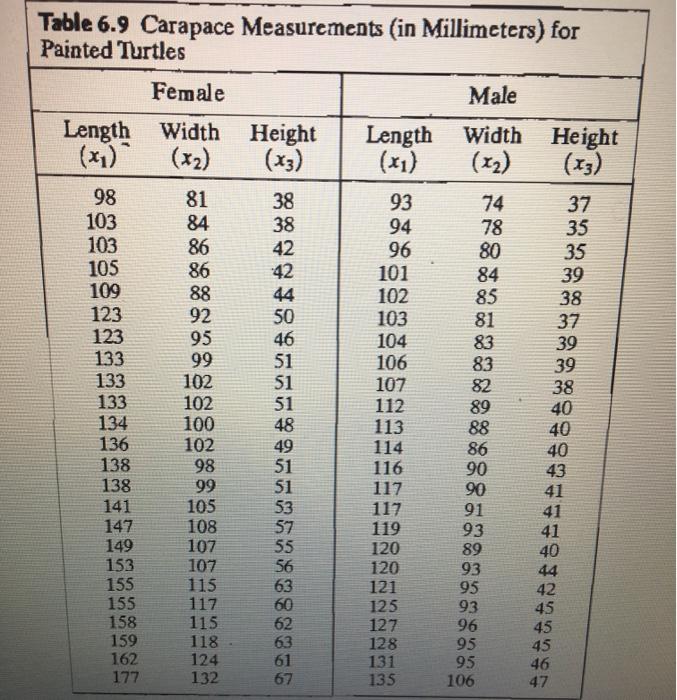
6.18. Jolicoeur and Mosimann [12] studied the relationship of size and shape for painted tur- tles. Table 6.9 contains their measurements on the carapaces


6.18. Jolicoeur and Mosimann [12] studied the relationship of size and shape for painted tur- tles. Table 6.9 contains their measurements on the carapaces of 24 female and 24 male turtles. (a) Test for equality of the two population mean vectors using a = .05. (b) If the hypothesis in Part a is rejected, find the linear combination of mean compo- nents most responsible for rejecting Ho. (c) Find simultaneous confidence intervals for the component mean differences. Compare with the Bonferroni intervals. Hint: You may wish to consider logarithmic transformations of the observations. Table 6.9 Carapace Measurements (in Millimeters) for Painted Turtles Female Male Length Width Width Height Length Width Height (x) (x) (x3) (x) (x) (x3) 98 81 38 93 74 37 103 84 38 94 78 35 103 86 42 96 80 35 105 86 42 101 84 109 88 44 102 85 123 92 50 103 81 123 95 46 104 83 133 99 51 106 83 133 102 51 107 82 133 102 51 112 89 134 100 48 113 88 136 102 49 114 86 138 98 51 116 90 138 99 51 117 90 141 105 53 117 91 147 108 57 119 93 149 107 55 120 89 153 107 56 120 93 155 115 63 121 95 155 117 125 93 158 115 127 96 159 118 128 95 162 124 131 95 177 132 135 106 60 62 63 61 67 39 38 37 39 39 38 40 40 40 43 41 41 41 40 44 42 45 45 45 46 47
Step by Step Solution
★★★★★
3.48 Rating (174 Votes )
There are 3 Steps involved in it
Step: 1
Test of equality of two population mean vector using a 05 S 103 80...
Get Instant Access to Expert-Tailored Solutions
See step-by-step solutions with expert insights and AI powered tools for academic success
Step: 2

Step: 3

Ace Your Homework with AI
Get the answers you need in no time with our AI-driven, step-by-step assistance
Get Started


