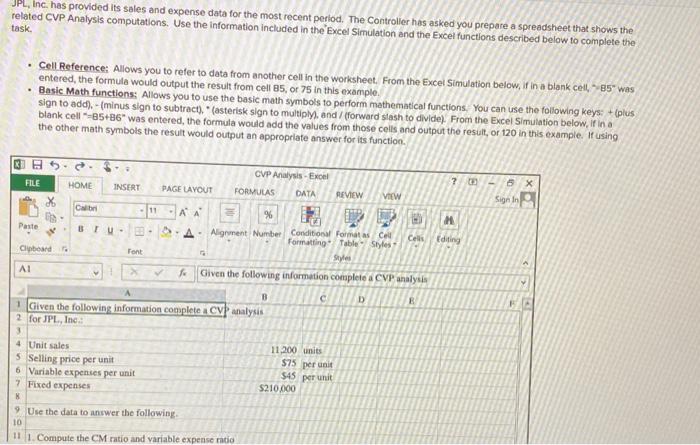
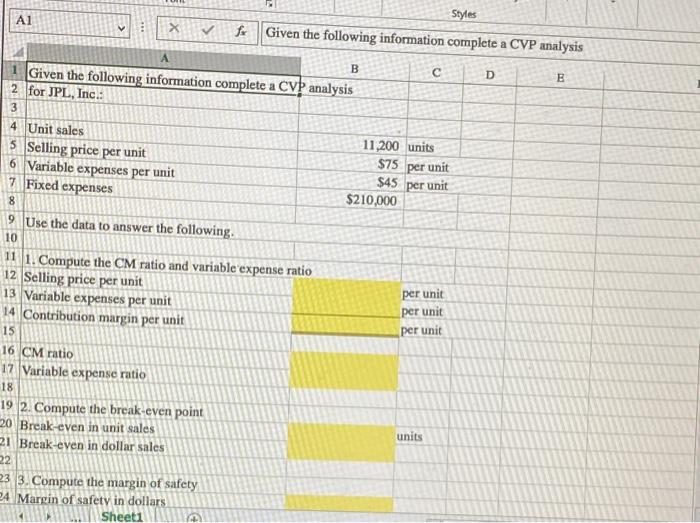
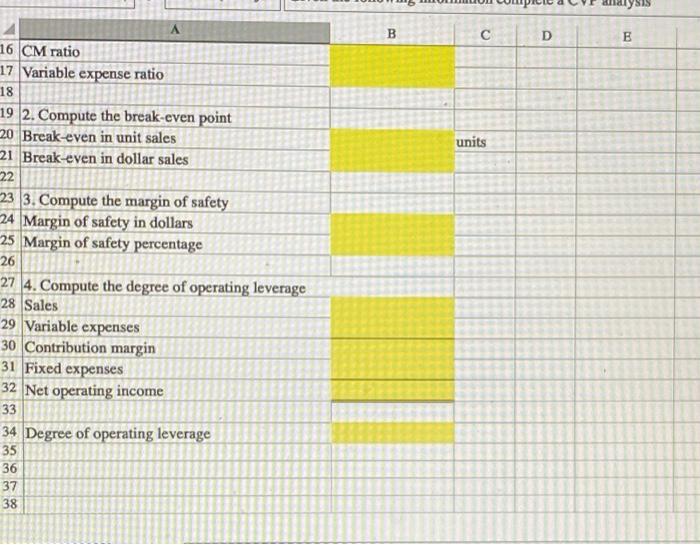
JPL Inc. has provided its sales and expense data for the most recent period. The Controller has asked you prepare a spreadsheet that shows the related CVP Analysis computations. Use the information included in the Excel Simulation and the Excel functions described below to complete the task Cell Reference: Allows you to refer to data from another cell in the worksheet. From the Excel Simulation below, if in a blank cell" 85" was entered the formula would output the result from cell 85, or 75 in this example, Basic Math functions: Allows you to use the basic math symbols to perform mathematical functions. You can use the following keys (plus sign to add). - (minus sign to subtract), asterisk sign to multiply), and/(forward slash to divide). From the Excel Simulation below, if in a blank cell-85+86 was entered the formula would add the values from those cells and output the result, or 120 in this example. If using the other math symbols the result would output an appropriate answer for its function. ? 6 x Sign In H. CVP Analysis - Excel FILE HOME INSERT PAGE LAYOUT FORMULAS DATA REVIEW VIEW X Calib -111 AA % Paste BIU. DA Alignment Number Conditional Formatas Cell Cells Formatting Table Styles Clipboard Font Styles AI Given the following information completo a CVP analysis B c D E 1 Given the following information complete CV analysis 2 for JPL, Inc.: Editing 4 Unit sales 5 Selling price per unit 6 Variable expenses per unit 7 Fixed expenses 11.200 units $75 per un $45 per unit $210.000 9 Use the data to answer the following 10 11 1. Compute the CM ratio and variable expense ratio A1 Styles X for Given the following information complete a CVP analysis B D E A Given the following information complete a CV analysis 2 for JPL, Inc.: 3 4 Unit sales 11,200 units 3 Selling price per unit $75 per unit 6. Variable expenses per unit $45 per unit 7 Fixed expenses $210,000 8 9. Use the data to answer the following. 10 11 1. Compute the CM ratio and variable expense ratio 12 Selling price per unit 13 Variable expenses per unit 14. Contribution margin per unit 15 16 CM ratio 17 Variable expense ratio 18 19 2. Compute the break-even point 20 Break-even in unit sales units 21 Break-even in dollar sales 22 23 3. Compute the margin of safety 24 Margin of safety in dollars Sheeti per unit per unit per unit dysis A B D E units 16 CM ratio 17 Variable expense ratio 18 19 2. Compute the break-even point 20 Break-even in unit sales 21 Break-even in dollar sales 22 23 3. Compute the margin of safety 24 Margin of safety in dollars 25 Margin of safety percentage 26 27 4. Compute the degree of operating leverage 28 Sales 29 Variable expenses 30 Contribution margin 31 Fixed expenses 32 Net operating income 33 34 Degree of operating leverage 35 36 37 38