Answered step by step
Verified Expert Solution
Link Copied!

Question

1 Approved Answer

Jsing your calculator/JMP and each of the datasets below, a) construct an appropriate QQPlot nd b) use the QQPlot to determine whether the data can
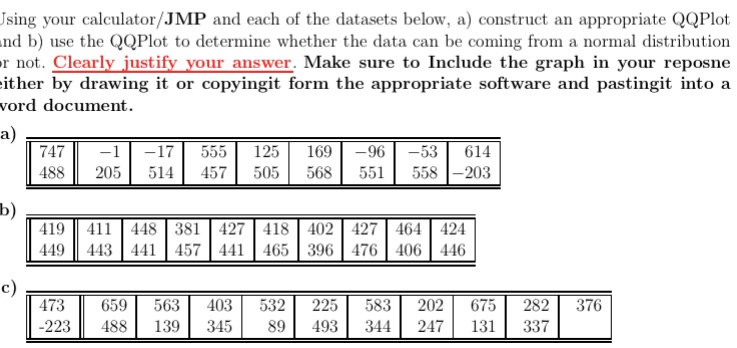
image text in transcribed
Jsing your calculator/JMP and each of the datasets below, a) construct an appropriate QQPlot nd b) use the QQPlot to determine whether the data can be coming from a normal distribution r not. Clearly justify your answer. Make sure to Include the graph in your reposne ither by drawing it or copyingit form the appropriate software and pastingit into a word document. a) 747 -1 -17 555 125 169 96 -53 614 488 205 514 457 505 568 551 558 -203 b) 419 411 448 381 427 418 402 427 464 424 449 443 441 457 441 465 396 476 406 446 c) 473 659 563 403 532 225 583 202 675 282 376 -223 488 139 345 89 493 344 247 131 337

Step by Step Solution

There are 3 Steps involved in it

Step: 1

blur-text-image

Get Instant Access to Expert-Tailored Solutions

See step-by-step solutions with expert insights and AI powered tools for academic success

Step: 2

blur-text-image

Step: 3

blur-text-image

Ace Your Homework with AI

Get the answers you need in no time with our AI-driven, step-by-step assistance

Get Started

Recommended Textbook for

An Introduction to Analysis

Authors: William R. Wade

4th edition

132296381, 978-0132296380

More Books

Students also viewed these Mathematics questions