

Answered step by step
Verified Expert Solution
Question
1 Approved Answer
just answer 1d and #2 1. For each of the following temperature scenarios, draw* a graph that contains Gibbs free energy curves of all the
just answer 1d and #2 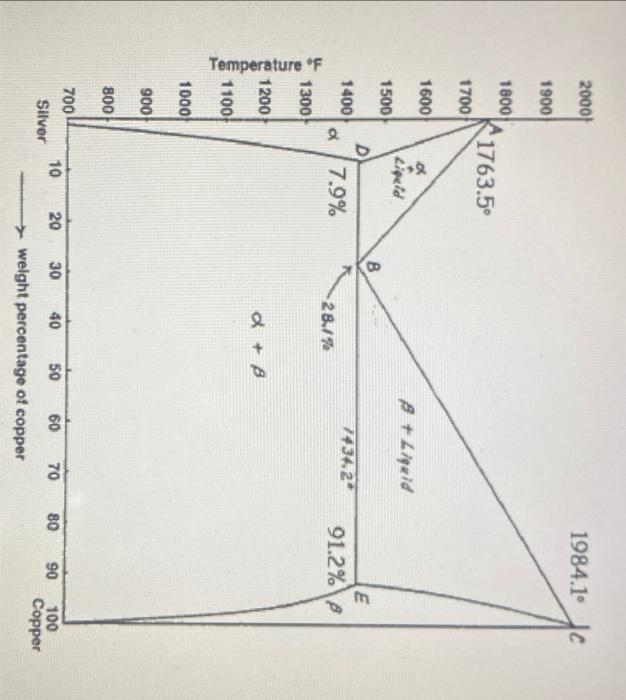
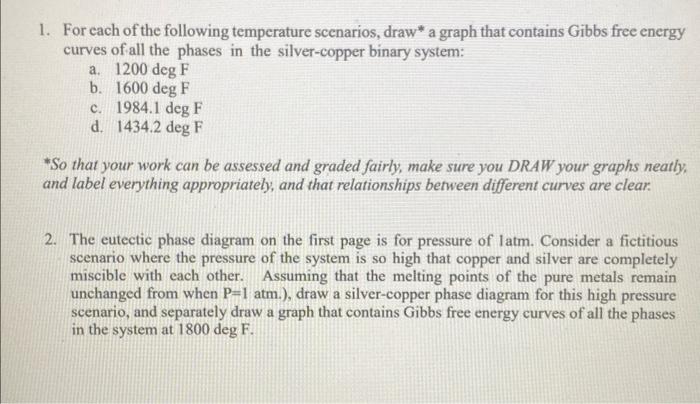
1. For each of the following temperature scenarios, draw* a graph that contains Gibbs free energy curves of all the phases in the silver-copper binary system: a. 1200degF b. 1600degF c. 1984.1degF d. 1434.2degF *So that your work can be assessed and graded fairly, make sure you DRAW your graphs neatly, and label everything appropriately, and that relationships between different curves are clear: 2. The eutectic phase diagram on the first page is for pressure of latm. Consider a fictitious scenario where the pressure of the system is so high that copper and silver are completely miscible with each other. Assuming that the melting points of the pure metals remain unchanged from when P=1atm.), draw a silver-copper phase diagram for this high pressure scenario, and separately draw a graph that contains Gibbs free energy curves of all the phases in the system at 1800 deg F Step by Step Solution
There are 3 Steps involved in it
Step: 1

Get Instant Access to Expert-Tailored Solutions
See step-by-step solutions with expert insights and AI powered tools for academic success
Step: 2

Step: 3
Ace Your Homework with AI
Get the answers you need in no time with our AI-driven, step-by-step assistance
Get Started
Coulson And Richardsons Chemical Engineering Volume 2A Particulate Systems And Particle Technology
Authors: R. P. Chhabra, Basavaraj Gurappa
6th Edition
0081010982, 9780081010983