

Question
Just do question 2 2. Estimate the closing share price for Dollarama at Jan 31, 2021 (do the best you can, it wont be a
Just do question 2
2. Estimate the closing share price for Dollarama at Jan 31, 2021 (do the best you can, it wont be a precise measurement).
- Multiply your estimated Jan 31, 2021 share price by 310,266,429. This is the exact number of common shares outstanding at Jan 31, 2021 (and is close to the weighted average number of common shares outstanding throughout all of fiscal 2021, which you used in part 1 i)). The value you have calculated is referred to as Dollaramas market capitalization at Jan 31, 2021.
- Compare the market capitalization value you calculated in part 3 i) to the Jan 31, 2021 value for total shareholders equity on the statement of financial position. Is the market capitalization higher, lower, or equal to total shareholders equity?
- Should the market capitalization you calculated be equal to the amounts shown for shareholders equity on the companys financial statements? Explain (why or why not). [Hint: How are the values for shareholders equity in the balance sheet determined? What type of factors influence market share price? If you believe there is no relationship between the market capitalization and the amount of shareholders equity in the balance sheet, explain why not.]
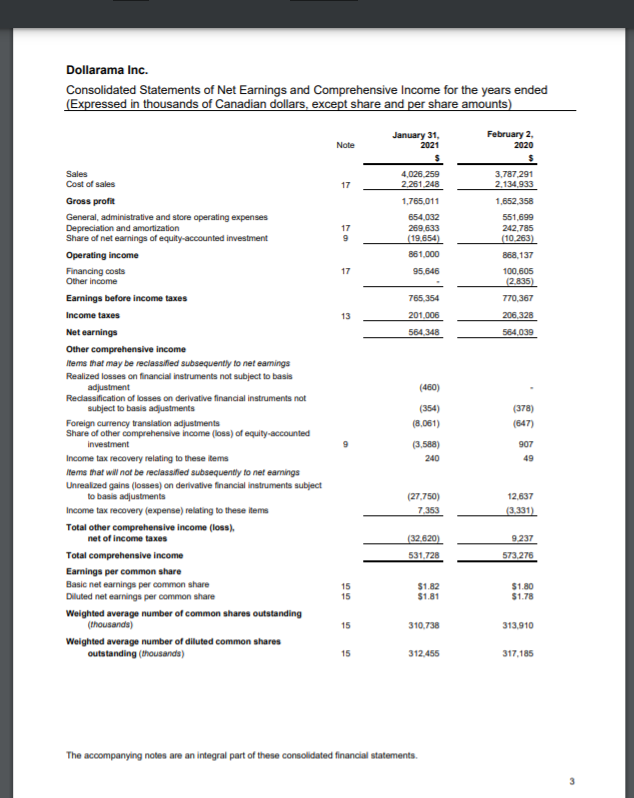
1. On the consolidated statements of net earnings and comprehensive income on page 3, find the basic earnings per common share amount provided near the bottom, which is NOT in thousands of dollars. i) Prove the calculation of the basic earnings per share of $1.82 in fiscal 2021 (subject to small rounding error). You will need to know the weighted average number of common shares outstanding in the fiscal year which is also provided at 310,738,000.
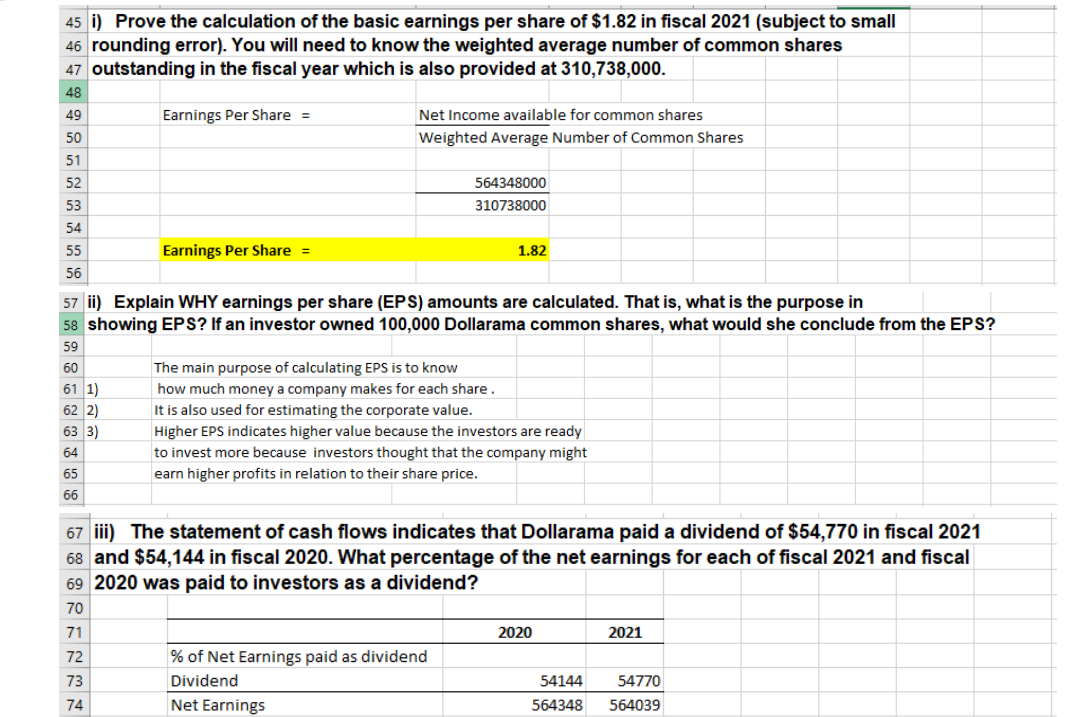
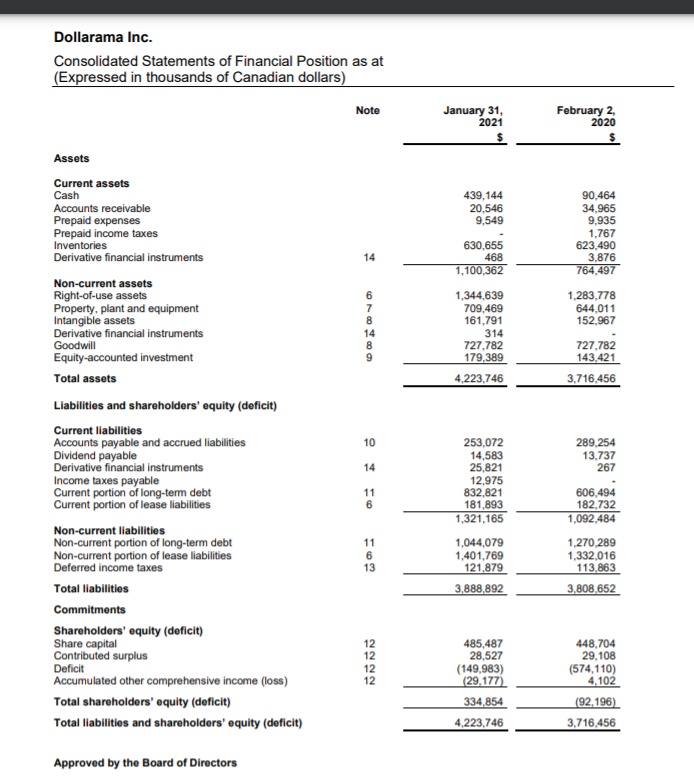
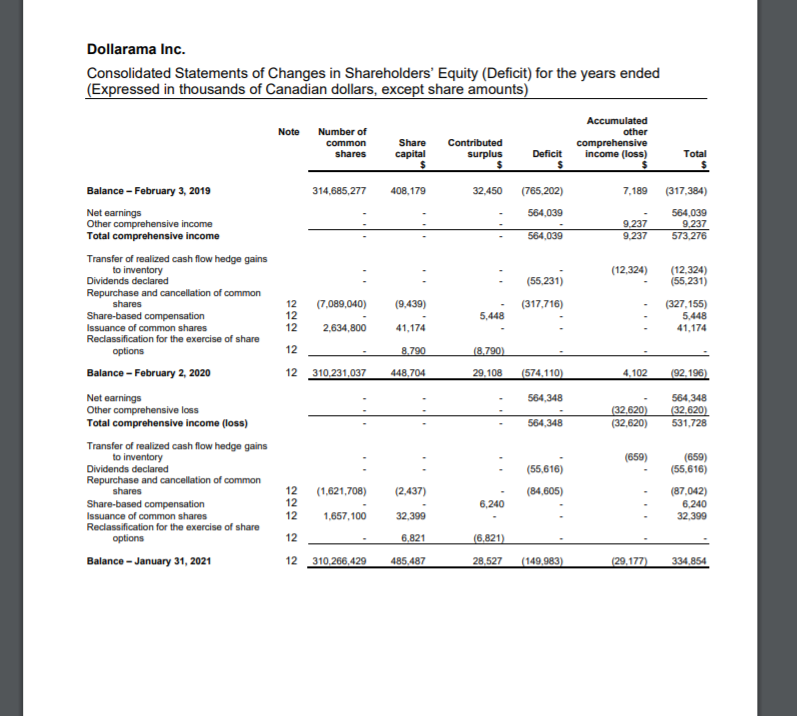
Dollarama Inc. Consolidated Statements of Net Earnings and Comprehensive Income for the years ended (Expressed in thousands of Canadian dollars, except share and per share amounts) January 31, 2021 February 2, 2020 Note 4,026.259 2.261 248 17 1.765011 17 654,032 269.633 (19.654) 861.000 3.787291 2.134.933 1,652,358 551,699 242,785 (10.263) 868,137 100,605 (2.835) 770,367 206,328 564,039 17 95.646 765,354 13 201.006 564,348 (460) Sales Cost of sales Gross profit General, administrative and store operating expenses Depreciation and amortization Share of net earnings of equity-accounted investment Operating income Financing costs Other income Earnings before income taxes Income taxes Net earnings Other comprehensive income Items that may be reclassified subsequently to net eamings Realized losses on financial instruments not subject to basis adjustment Redassification of losses on derivative financial instruments not subject to basis adjustments Foreign currency translation adjustments Share of other comprehensive income (loss) of equity-accounted investment Income tax recovery relating to these items Items that will not be reclassified subsequently to net eamings Unrealized gains (losses) on derivative financial instruments subject to basis adjustments Income tax recovery (expense) relating to these items Total other comprehensive Income (loss), net of income taxes Total comprehensive income Earnings per common share Basic net earnings per common share Diluted net earnings per common share Weighted average number of common shares outstanding (thousands) Weighted average number of diluted common shares outstanding (thousands) (354) (8,061) (378) (647) (3,588) 240 907 49 (27,750) 7,353 12,637 (3.331) (32.620) 9237 573.276 531,728 15 15 $1.82 $1.81 $1.80 $1.78 15 310.738 313.910 15 312.455 317,185 The accompanying notes are an integral part of these consolidated financial statements. Dollarama Inc. Consolidated Statements of Financial Position as at (Expressed in thousands of Canadian dollars) Note January 31, 2021 February 2 2020 439,144 20,546 9,549 90,464 34,965 9,935 1,767 623,490 3,876 764,497 14 630,655 468 1,100,362 6 7 8 14 8 9 1,283,778 644,011 152,967 1,344,639 709,469 161,791 314 727,782 179,389 4,223,746 727,782 143,421 3.716,456 Assets Current assets Cash Accounts receivable Prepaid expenses Prepaid income taxes Inventories Derivative financial instruments Non-current assets Right-of-use assets Property, plant and equipment Intangible assets Derivative financial instruments Goodwill Equity-accounted investment Total assets Liabilities and shareholders' equity (deficit) Current liabilities Accounts payable and accrued liabilities Dividend payable Derivative financial instruments Income taxes payable Current portion of long-term debt Current portion of lease liabilities Non-current liabilities Non-current portion of long-term debt Non-current portion of lease liabilities Deferred income taxes Total liabilities Commitments Shareholders' equity (deficit) Share capital Contributed surplus Deficit Accumulated other comprehensive income (loss) Total shareholders' equity (deficit) Total liabilities and shareholders' equity (deficit) 10 14 253,072 14,583 25,821 12,975 832,821 181,893 1,321,165 11 6 289,254 13.737 267 606.494 182.732 1,092.484 1,270,289 1,332,016 113,863 3,808,652 11 6 13 1,044,079 1,401,769 121,879 3,888,892 2222 12 12 12 12 485,487 28,527 (149,983) (29.177) 334,854 4,223,746 448,704 29,108 (574,110) 4,102 (92,196) 3.716.456 Approved by the Board of Directors Dollarama Inc. Consolidated Statements of Changes in Shareholders' Equity (Deficit) for the years ended (Expressed in thousands of Canadian dollars, except share amounts) Accumulated Note other Number of common shares Share capital Contributed surplus Deficit comprehensive income (loss) $ Total 314,685,277 408,179 32.450 (765,202) 7.189 (317,384) 564,039 564,039 9.237 573,276 9.237 9.237 564,039 (12,324) (12,324) (55.231) (55,231) (317,716) (9.439) NNN 5,448 (327,155) 5.448 41,174 41,174 12 (7,089,040) 12 12 2,634,800 12 12 310.231,037 8.790 Balance - February 3, 2019 Net earnings Other comprehensive income Total comprehensive income Transfer of realized cash flow hedge gains to inventory Dividends declared Repurchase and cancellation of common shares Share-based compensation Issuance of common shares Reclassification for the exercise of share options Balance - February 2, 2020 Net earnings Other comprehensive loss Total comprehensive income (loss) Transfer of realized cash flow hedge gains to inventory Dividends declared Repurchase and cancellation of common shares Share-based compensation Issuance of common shares Reclassification for the exercise of share options Balance - January 31, 2021 (8.790) 448,704 29.108 (574,110) 4.102 564,348 (92,196) 564,348 (32.620) 531,728 (32,620) (32,620) 564,348 (659) (55,616) (84.605) (2.437) 32,399 (659) (55,616) (87,042) 6,240 32,399 6,240 12 (1,621,708) 12 12 1,657,100 12 12 310,266,429 6.821 (6.821) 485,487 28.527 (149,983) (29,177) 334,854 45 i) Prove the calculation of the basic earnings per share of $1.82 in fiscal 2021 (subject to small 46 rounding error). You will need to know the weighted average number of common shares 47 outstanding in the fiscal year which is also provided at 310,738,000. 48 49 Earnings Per Share = Net Income available for common shares 50 Weighted Average Number of Common Shares 51 52 564348000 53 310738000 54 55 Earnings Per Share = 1.82 56 57 ii) Explain WHY earnings per share (EPS) amounts are calculated. That is, what is the purpose in 58 showing EPS? If an investor owned 100,000 Dollarama common shares, what would she conclude from the EPS? 59 60 61 1) 62 2) 63 3) 64 The main purpose of calculating EPS is to know how much money a company makes for each share. It is also used for estimating the corporate value. Higher EPS indicates higher value because the investors are ready to invest more because investors thought that the company might earn higher profits in relation to their share price. 65 66 67 iii) The statement of cash flows indicates that Dollarama paid a dividend of $54,770 in fiscal 2021 68 and $54,144 in fiscal 2020. What percentage of the net earnings for each of fiscal 2021 and fiscal 69 2020 was paid to investors as a dividend? 70 71 2020 2021 72 73 % of Net Earnings paid as dividend Dividend Net Earnings 54144 564348 54770 564039 74
Step by Step Solution
There are 3 Steps involved in it
Step: 1

Get Instant Access to Expert-Tailored Solutions
See step-by-step solutions with expert insights and AI powered tools for academic success
Step: 2

Step: 3
Ace Your Homework with AI
Get the answers you need in no time with our AI-driven, step-by-step assistance
Get Started
Financial Statements
Authors: Inc. BarCharts
1st Edition
1423223837, 978-1423223832