Just finished my hw, w
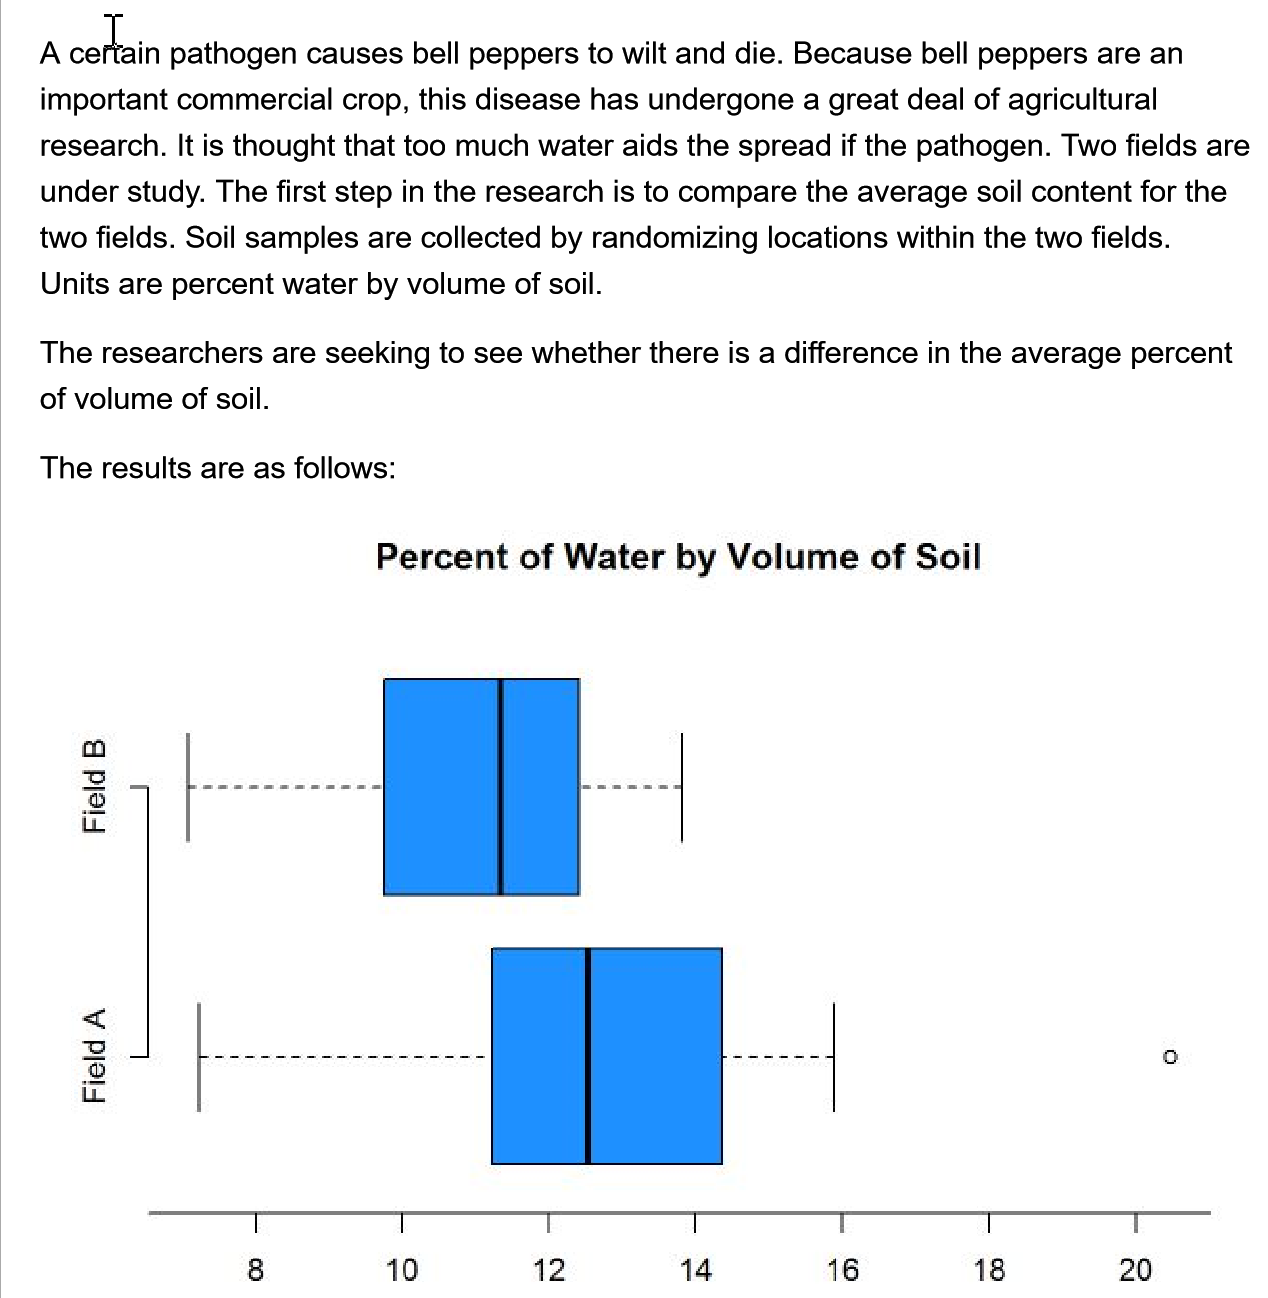
A certain pathogen causes bell peppers to wilt and die. Because bell peppers are an important commercial crop, this disease has undergone a great deal of agricultural research. It is thought that too much water aids the spread if the pathogen. Two fields are under study. The first step in the research is to compare the average soil content for the two fields. Soil samples are collected by randomizing locations within the two fields. Units are percent water by volume of soil. The researchers are seeking to see whether there is a difference in the average percent of volume of soil. The results are as follows: Percent of Water by Volume of Soil Field B Field A 8 10 12 14 16 18 20\f\fQ. Which of the following represents the null and alternative hypothesis? I o Option A.H. : P1 - P2 = 0, Ha : P1 - P2 7 0 o Option B. H. : /1 - M2 = 0, Ha : M1 - M2 0 o Option C. Ho : X1 - $2 = 0, Ha : X1 - 22 70 Option Option B. is the correct null and alternative. Q. Check whether each of the following conditions are met. . Does the data come from a random sample or from some sort of random mechanism? o Yes, condition is met. . We don't know whether the populations are normal. Will the procedure still be robust? O No, the sample sizes are toos v . Are the populations independent? O YesL"I.\" data: FieldA and FieldB t = , df = 36.561, p-value = 6.62363 alternative hypothesis: true difference in means is not equ al to 6 95 percent confidence interval: sample estimates: mean of x mean of y 12.82896 11.16617 0. Based on the summary statistics calculate the missing t test statistic from the R output: t statistic = 2'37 " Q. Give the set up for the 95% condence interval for the difference in averages. Use the degrees of freedom from the R output (round down). Estimate + Critical Value x Standard Error = 1.7 2.042 V X 0.712 V Q. Make a conclusion based on the previous results. There is convincing V evidence the average percent of water by volume in the soil between Field A and Field B differs. Based on the p-value, the test rejects V the null hypothesis. The 95% confidence interval and point estimate indicate the Field B has more V average percent by volume than Field A


