Answered step by step
Verified Expert Solution
Question
1 Approved Answer
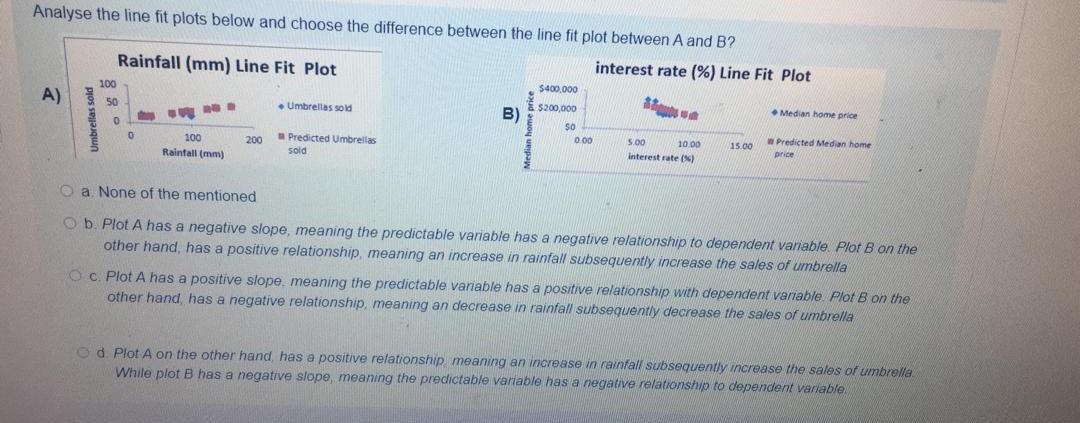
JUST GIVE THE ANSWERS ONLY NO NEED FOR EXPLANATION , WILL UPVOTE Analyse the line fit plots below and choose the difference between the line


JUST GIVE THE ANSWERS ONLY NO NEED FOR EXPLANATION , WILL UPVOTE
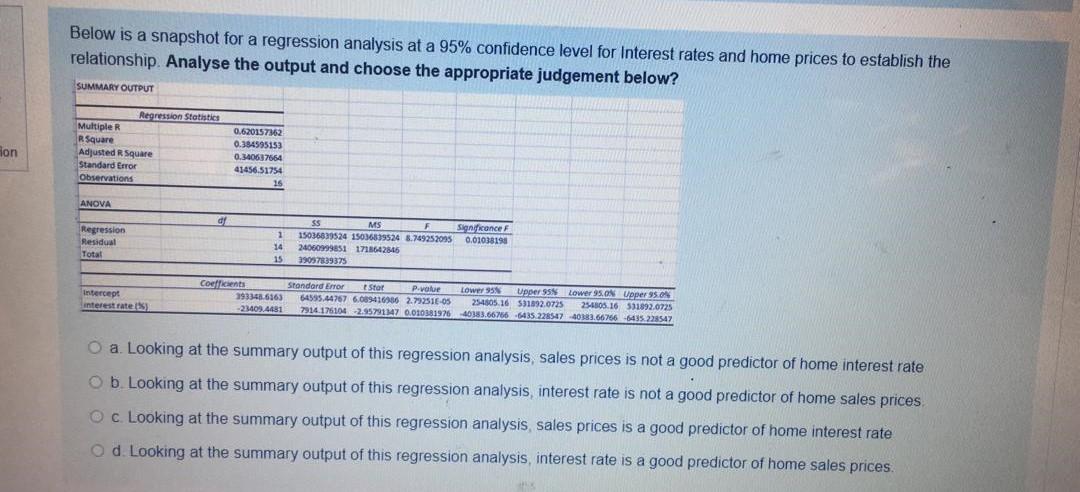
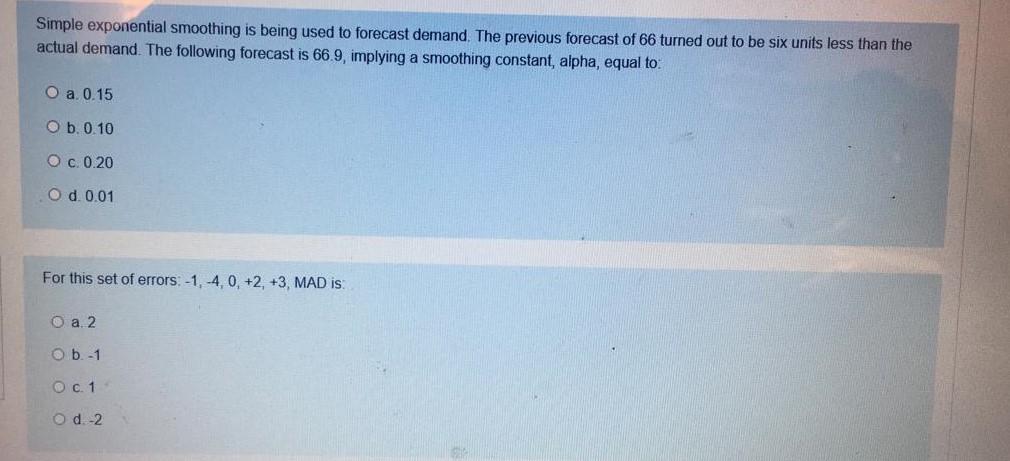
Analyse the line fit plots below and choose the difference between the line fit plot between A and B? Rainfall (mm) Line Fit Plot interest rate (%) Line Fit Plot $400,000 A) B) 100 w Umbrellas sold $200,000 8 Median home price Umbrellas sold 0 0 100 200 Predicted Umbrellas sold $0 000 5.00 10.00 Interest rate() 15.00 Rainfall (mm) Predicted Median home price a. None of the mentioned b. Plot A has a negative slope, meaning the predictable variable has a negative relationship to dependent variable. Plot B on the other hand, has a positive relationship, meaning an increase in rainfall subsequently increase the sales of umbrella c. Plot A has a positive slope, meaning the predictable variable has a positive relationship with dependent variable. Plot B on the other hand, has a negative relationship, meaning an decrease in rainfall subsequently decrease the sales of umbrella d. Plot A on the other hand, has a positive relationship, meaning an increase in rainfall subsequently increase the sales of umbrella While plot B has a negative slope, meaning the predictable variable has a negative relationship to dependent variable. Below is a snapshot for a regression analysis at a 95% confidence level for Interest rates and home prices to establish the relationship. Analyse the output and choose the appropriate judgement below? SUMMARY OUTPUT Regression Statistics Multiple R Square Adjusted R Square Standard Error Observations ion 0.620157162 0.384595153 0.340637564 41456.51754 16 ANOVA dy Regression Residual Total 1 14 15 55 MS F F Significance 15036839524 15036539524 8.749252095 0.01018198 240609996511718642845 39097839375 Intercept interest rates) Coefficients Standard Error Star P.value Lower 95% per 958 Lower 95.ON Upper 950 393348.6163 64595.44757 6.089416956 2.792516-05 254505.16 501892.0725 254505.16 551892.0725 -23409.4481 7314.1761042.95791147 0.010381976 40383.66766 5435 228547 40383.66766-6435.228547 O a. Looking at the summary output of this regression analysis, sales prices is not a good predictor of home interest rate b. Looking at the summary output of this regression analysis, interest rate is not a good predictor of home sales prices O C. Looking at the summary output of this regression analysis, sales prices is a good predictor of home interest rate Od Looking at the summary output of this regression analysis, interest rate is a good predictor of home sales prices A company uses exponential smoothing with alpha 0.05, this implies that the firm aims for a. a 0.95 forecast accuracy O b. a 5% forecast accuracy O c a margin an error of 95% O d. a 50% forecast accuracy Simple exponential smoothing is being used to forecast demand. The previous forecast of 66 turned out to be six units less than the actual demand. The following forecast is 66.9, implying a smoothing constant, alpha, equal to: O a 0.15 O b. 0.10 O c. 0.20 O d. 0.01 For this set of errors:-1, -4,0, +2, +3, MAD is: O a 2 Ob-1 O01 Od-2Step by Step Solution
There are 3 Steps involved in it
Step: 1

Get Instant Access to Expert-Tailored Solutions
See step-by-step solutions with expert insights and AI powered tools for academic success
Step: 2

Step: 3

Ace Your Homework with AI
Get the answers you need in no time with our AI-driven, step-by-step assistance
Get Started


