Answered step by step
Verified Expert Solution
Question
1 Approved Answer
Just need help with C The pre-defined MATLAB function filter.m is useful for generating the output of a causal difference equation given the equation parameters,


Just need help with C
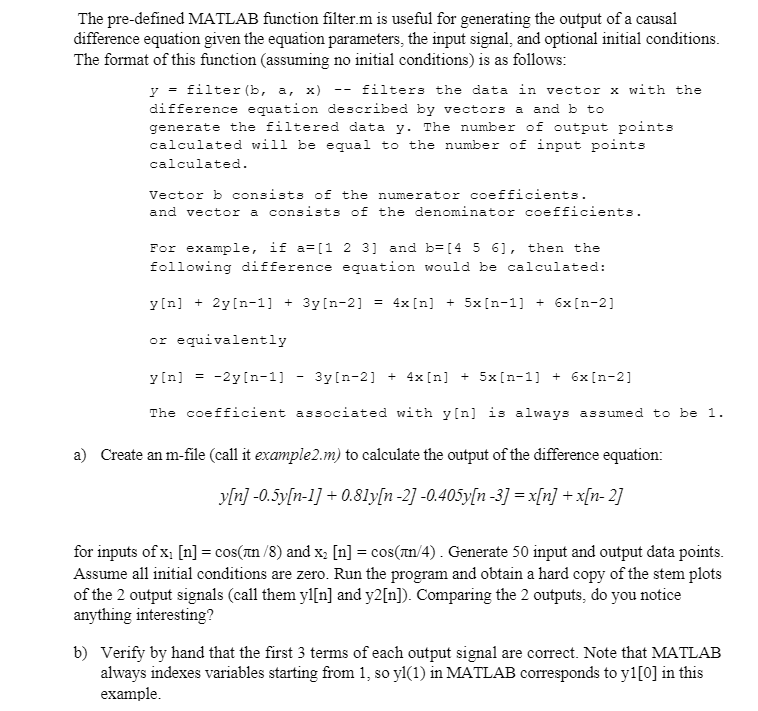
The pre-defined MATLAB function filter.m is useful for generating the output of a causal difference equation given the equation parameters, the input signal, and optional initial conditions. The format of this function (assuming no initial conditions) is as follows: y = filter (b, a, x) filters the data in vector x with the difference equation described by vectors a and b to generate the filtered data y. The number of output points calculated will be equal to the number of input points calculated. Vector b consists of the numerator coefficients. and vector a consists of the denominator coefficients. For example, if a= [1 2 3] and b= [4 5 6), then the following difference equation would be calculated: y[n] + 2y[n-1] + 3y[n-2] = 4x[n] + 5x [n-1] + 6x[n-2] or equivalently y[n] = -2yin-1] 3y[n-2] + 4x[n] + 5x[n-1] + 6x[n-2] The coefficient associated with y[n] is always assumed to be 1. a) Create an m-file (call it example2.m) to calculate the output of the difference equation: y[n] -0.5y[n-l] +0.81y[n-2] -0.405y[n-3) = x[n] + x[n-2] for inputs of x, [n] = cos(in/8) and x2 [n] = cos(in/4). Generate 50 input and output data points. Assume all initial conditions are zero. Run the program and obtain a hard copy of the stem plots of the 2 output signals (call them yi[n] and y2[n]). Comparing the 2 outputs, do you notice anything interesting? b) Verify by hand that the first 3 terms of each output signal are correct. Note that MATLAB always indexes variables starting from 1, so yl(1) in MATLAB corresponds to y1[0] in this example. c) Determine the impulse response of this discrete-time system by generating a discrete-time impulse signal [10000...] of length 50 and passing it through the filter. Obtain a hard copy of the stem plot of the impulse response, h[n]. Verify by hand that the first 3 terms of the impulse response are correct. The pre-defined MATLAB function filter.m is useful for generating the output of a causal difference equation given the equation parameters, the input signal, and optional initial conditions. The format of this function (assuming no initial conditions) is as follows: y = filter (b, a, x) filters the data in vector x with the difference equation described by vectors a and b to generate the filtered data y. The number of output points calculated will be equal to the number of input points calculated. Vector b consists of the numerator coefficients. and vector a consists of the denominator coefficients. For example, if a= [1 2 3] and b= [4 5 6), then the following difference equation would be calculated: y[n] + 2y[n-1] + 3y[n-2] = 4x[n] + 5x [n-1] + 6x[n-2] or equivalently y[n] = -2yin-1] 3y[n-2] + 4x[n] + 5x[n-1] + 6x[n-2] The coefficient associated with y[n] is always assumed to be 1. a) Create an m-file (call it example2.m) to calculate the output of the difference equation: y[n] -0.5y[n-l] +0.81y[n-2] -0.405y[n-3) = x[n] + x[n-2] for inputs of x, [n] = cos(in/8) and x2 [n] = cos(in/4). Generate 50 input and output data points. Assume all initial conditions are zero. Run the program and obtain a hard copy of the stem plots of the 2 output signals (call them yi[n] and y2[n]). Comparing the 2 outputs, do you notice anything interesting? b) Verify by hand that the first 3 terms of each output signal are correct. Note that MATLAB always indexes variables starting from 1, so yl(1) in MATLAB corresponds to y1[0] in this example. c) Determine the impulse response of this discrete-time system by generating a discrete-time impulse signal [10000...] of length 50 and passing it through the filter. Obtain a hard copy of the stem plot of the impulse response, h[n]. Verify by hand that the first 3 terms of the impulse response are correctStep by Step Solution
There are 3 Steps involved in it
Step: 1

Get Instant Access to Expert-Tailored Solutions
See step-by-step solutions with expert insights and AI powered tools for academic success
Step: 2

Step: 3

Ace Your Homework with AI
Get the answers you need in no time with our AI-driven, step-by-step assistance
Get Started


