Answered step by step
Verified Expert Solution
Link Copied!

Question

1 Approved Answer

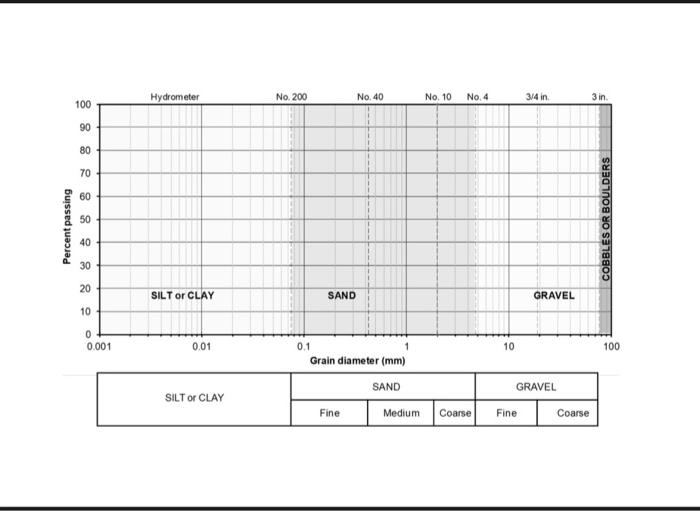
Just solve the graph in the second picture Following are the results of a Sieve Analysis Test. a. Complete the required calculations. b. Draw the

Just solve the graph in the second picture image text in transcribed
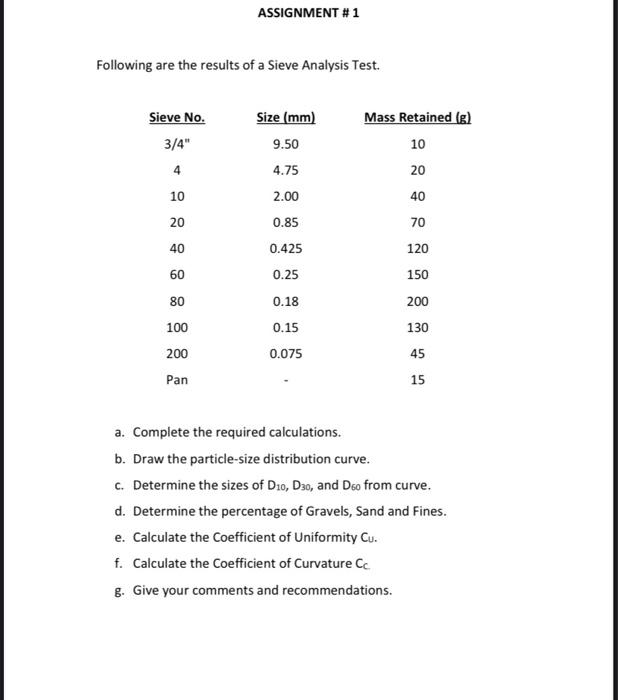
image text in transcribed
Following are the results of a Sieve Analysis Test. a. Complete the required calculations. b. Draw the particle-size distribution curve. c. Determine the sizes of D10,D30, and D60 from curve. d. Determine the percentage of Gravels, Sand and Fines. e. Calculate the Coefficient of Uniformity Cuu. f. Calculate the Coefficient of Curvature CC. g. Give your comments and recommendations

Step by Step Solution

There are 3 Steps involved in it

Step: 1

blur-text-image

Get Instant Access to Expert-Tailored Solutions

See step-by-step solutions with expert insights and AI powered tools for academic success

Step: 2

blur-text-image_2

Step: 3

blur-text-image_3

Ace Your Homework with AI

Get the answers you need in no time with our AI-driven, step-by-step assistance

Get Started

Recommended Textbook for

Introduction To Chemical Engineering

Authors: S. Pushpavanam

1st Edition

8120345770, 978-8120345775

More Books

Students also viewed these Chemical Engineering questions

Question

7. Explain how to recruit a more diverse workforce.

Answered: 1 week ago

Question

Is conflict always unhealthy? Why or why not? (Objective 4)

Answered: 1 week ago