

Answered step by step
Verified Expert Solution
Question
1 Approved Answer
just trying to check my answers to see if they're correct or not .. please help? Which of the following graphs illustrates the behavior of
just trying to check my answers to see if they're correct or not .. please help?
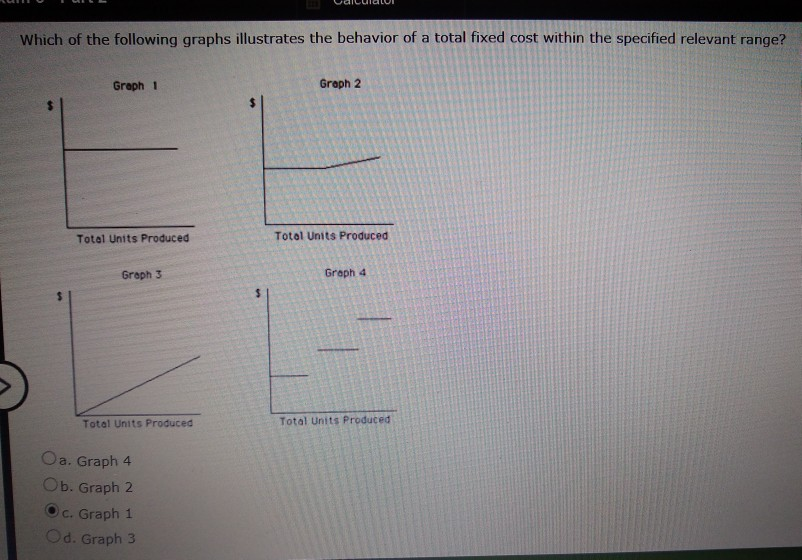
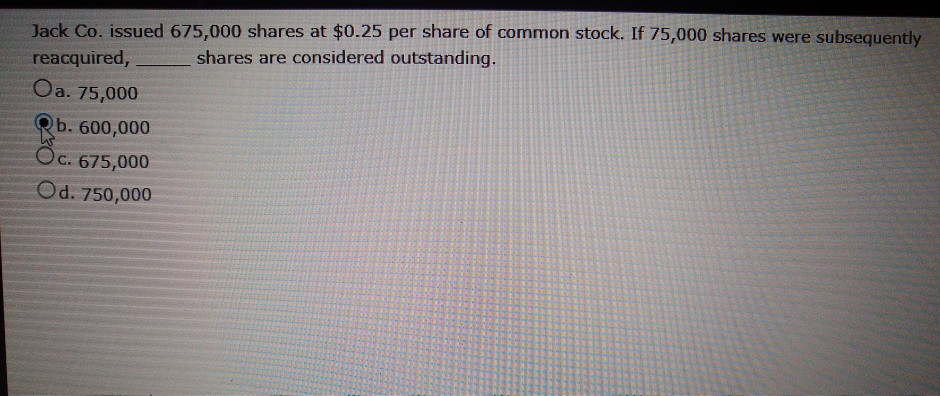
Which of the following graphs illustrates the behavior of a total fixed cost within the specified relevant range? Greph 1 Graph 2 Totel Units Produced Total Units Produced Graph 3 Greph 4 Total Units Produced Total Units Produced Oa. Graph 4 Ob. Graph 2 c. Graph 1 Od. Graph 3 Jack Co. issued 675,000 shares at $0.25 per share of common stock. If 75,000 shares were subsequently reacquired Oa. 75,000 Qb. 600,000 shares are considered outstanding. C. 675,000 Od. 750,000Step by Step Solution
There are 3 Steps involved in it
Step: 1

Get Instant Access to Expert-Tailored Solutions
See step-by-step solutions with expert insights and AI powered tools for academic success
Step: 2

Step: 3
Ace Your Homework with AI
Get the answers you need in no time with our AI-driven, step-by-step assistance
Get Started
Accounting For Improvement
Authors: Sten Jonsson
1st Edition
0080408125, 978-0080408125