just want tk lnow which company would be better by a CCP and why it is the better company.

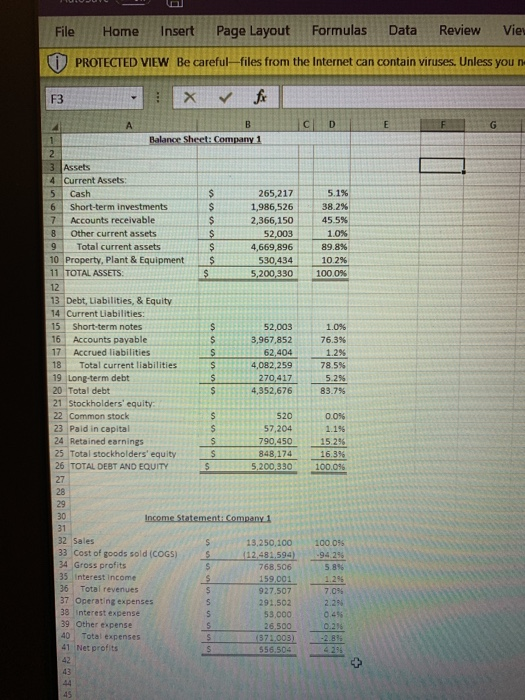
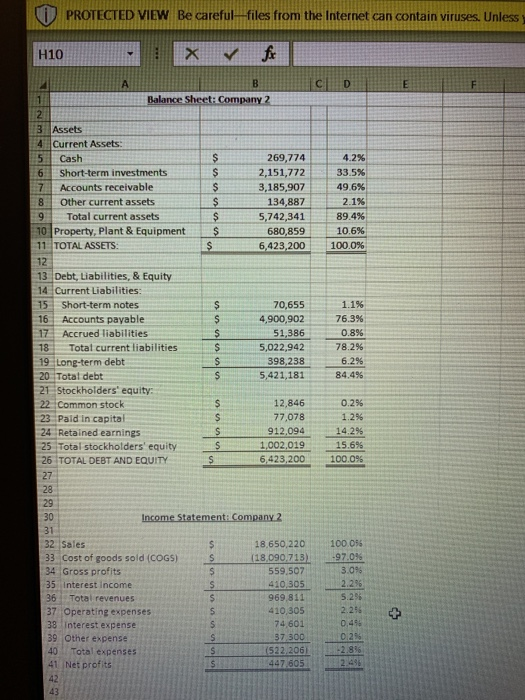
OPEN IN NEW TAB Franchise opportunity Recently, you and a partner were presented with two different franchise opportunities. Both businesses are profitable, and you know that you want to invest in one of them. However, you are not sure which franchise would suit you best. You have some basic financial information at your disposal that may yield additional insights. Task findings, which franchise would you choose? Create a PPT presentation of no more than 3 slides and present your findings in a J4 minute video. Investing Einancials File Home Insert Page Layout Formulas Data Review Vie PROTECTED VIEW Be careful -files from the Internet can contain viruses. Unless you n F3 -Current Assets. 5 Cash 6 Short-term investments 265,2171 + 5.1% 1,986,526| -38.2% 2,366,150| 45.5% 1.0% 4,669,896. , 89.8% 102% 1000% Accounts receivable 8 Other current assets 9 Total current assets 10 Property, Plant & Equipment 11 TOTAL ASSETS: 12 13 Debt, Liabilities, & Equity 14 Current Liabilities: 15 Short-term notes 16 Accounts payable 17 Accrued liabilities 18 Total current liabilities 19 Long-term debt 20 Total debt 21 Stockholders' equity 22 Common stock 23 Paid in capital 24 Retained earnings 25 Total stockholders' equity 26 TOTAL DEBT AND EQUITY 27 28 s 52,003 $ 530,434 5200330 1.0% 3,967,852 76.3% 62,404 1.2% 4,082,25978.5% 5.2% 4,352,676 83.7% 52,003 S 270,417 520 57,204 790,450 848,174 5.200,330 0.0% 1.1% 152% 16.3% 100.0% $ 29 30 31 32 Sales 331 Cost of goods sold (COGS) 13,250,100 100 096 -94 2% 5 896 S 112,481,594, 768,506 , 34 Gross profits 35 Interest income 36 Total revenues 159 001 927.507 291.502 70 Operating expenses 2.2% 4% 0.2% 33 Interest expense 39 Other expense 0 Total expenses 41 Net profits 53,000 26500 43 PROTECTED VIEW Be careful -files from the Internet can contain viruses. Unless y H10 Balance Sheet: Company2 3 Assets 4 Current Assets: 5 Cash 6 Short-term investments 7Accounts receivable 8 Other current assets$ 9Total current assets 10 Property, Plant & EquipmentS 1 TOTAL ASSETS: 12 13 Debt, Liabilities, & Equity 269,774 2,151,772/ 3,185,907: 134,887 5,742,341 680,859 4.2% 33.5% 496% 2.1% 89.4% 10.6% : $ : 6,423,200 100.07 14 Current Liabilities: 151 Short-term notes 16 Accounts payable 17 Accrued liabilities 18 Total current liabilities$ 1.1% 76.3% 0.8% 78.2% 6.2% 84.4% 70,655 4,900,902 5,022,942 398,238 5,421,181 s 19 Long-term debt 20 Totat debt 21 Stockholders' equity 22 Common stock 23 Pald in capital 24 Retained earnings 25 Total stockholders' equity 26 TOTAL DEBT AND EQUITY 12,846 77,078 912,094 1,002,019 6,423,20O 0.2% 1.2% 15.6% 100.0% 28 29 30 I 31 32 Sales 33 Cost of goods sold (COGS) S 34 Gross profits 35 Interest income 36 Total revenues 37 Operating expenses 38 Interest expense 39 Other expense 40Total expenses 41 Net profits 42 43 100 0% -97.0% 3.0% 18.650.220 (18090713) 559 5073 O8 410 30522 969,811 5.2% 410,305 2.2% ) 74.601 0,4% 2.8%


