

Question
K Assume that a randomly selected subject is given a bone density test Bone density test scores are normally distributed with a mean of 0

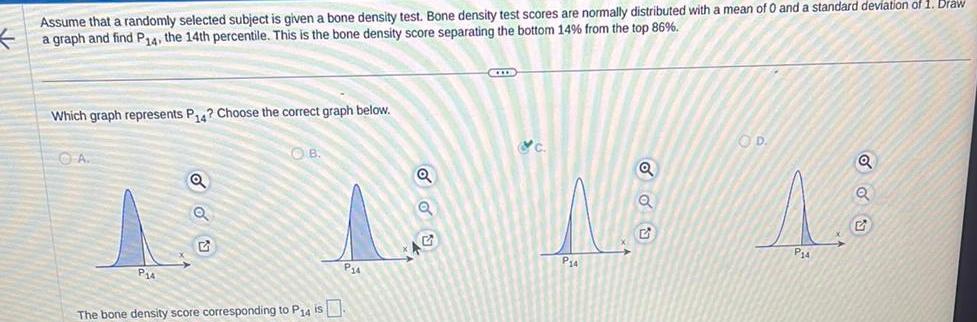
K Assume that a randomly selected subject is given a bone density test Bone density test scores are normally distributed with a mean of 0 and a standard deviation of 1 Draw a graph and find P14 the 14th percentile This is the bone density score separating the bottom 14 from the top 86 Which graph represents P14 Choose the correct graph below A P14 Q Q OB The bone density score corresponding to P14 is P 4 Q c P14 Q OD P14 Q Q
Step by Step Solution
There are 3 Steps involved in it
Step: 1

Get Instant Access to Expert-Tailored Solutions
See step-by-step solutions with expert insights and AI powered tools for academic success
Step: 2

Step: 3
Ace Your Homework with AI
Get the answers you need in no time with our AI-driven, step-by-step assistance
Get Started
Visual Differential Geometry And Forms A Mathematical Drama In Five Acts
Authors: Tristan Needham
1st Edition
0691219893, 9780691219899