Answered step by step
Verified Expert Solution
Question
1 Approved Answer
K Consider the data set given in the accompanying table. Complete parts (a) through (d). Click the icon to view the data table. (a)

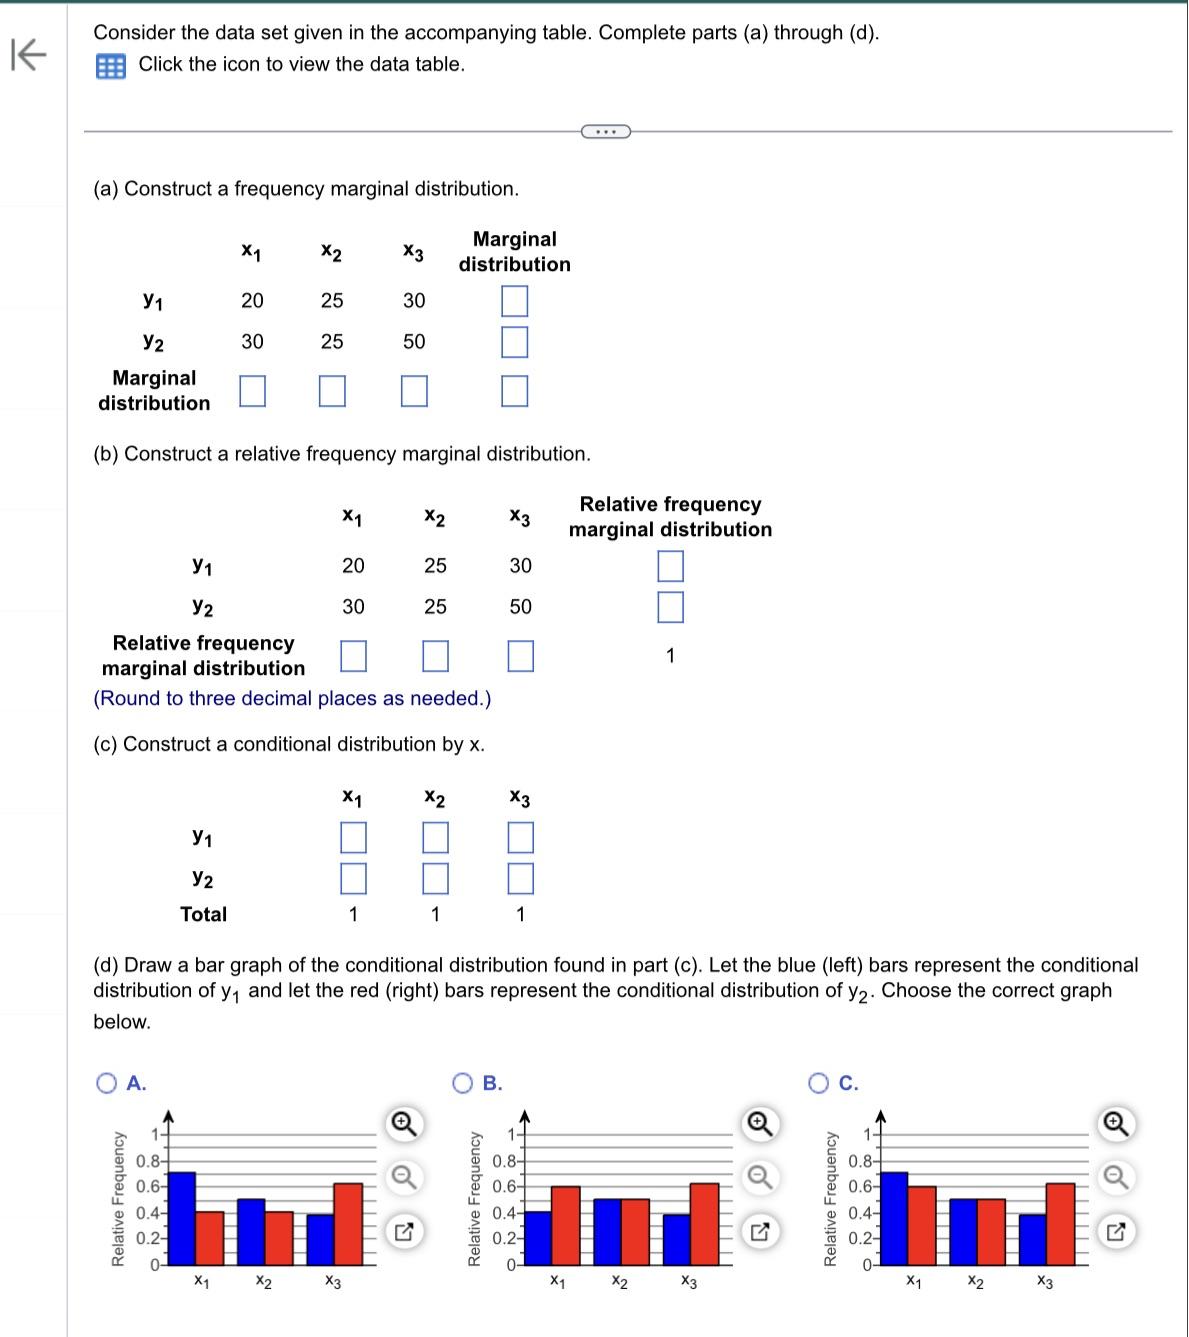
K Consider the data set given in the accompanying table. Complete parts (a) through (d). Click the icon to view the data table. (a) Construct a frequency marginal distribution. A. Y Y2 Marginal distribution (b) Construct a relative frequency marginal distribution. Y Y Relative Frequency 1+ 0.8+ 0.6- 0.4- 0.2- 0- X1 Y Y2 Total 20 30 X1 X2 25 25 X1 X2 20 30 Relative frequency marginal distribution (Round to three decimal places as needed.) (c) Construct a conditional distribution by x. X1 X3 1 X3 30 50 |||| X2 25 25 Q Marginal distribution X2 (d) Draw a bar graph of the conditional distribution found in part (c). Let the blue (left) bars represent the conditional distribution of y1 and let the red (right) bars represent the conditional distribution of y2. Choose the correct graph below. 1 B. X3 30 50 Relative Frequency X3 1 14 0.8 0.6- 0.4- 0.2- 0- Relative frequency marginal distribution X1 1 X2 X3 ||||||| Relative Frequency C. 14 0.8 0.6- 0.4- 0.2- 0- X1 X2 X3 |||||| Q
Step by Step Solution
There are 3 Steps involved in it
Step: 1

Get Instant Access to Expert-Tailored Solutions
See step-by-step solutions with expert insights and AI powered tools for academic success
Step: 2

Step: 3

Ace Your Homework with AI
Get the answers you need in no time with our AI-driven, step-by-step assistance
Get Started


